|
||||||||||||||||||||||||||||||||||||||||||||||||||||||||||||||||
|
90 Years of Records | Trending Averages | No
Limits to Performance ? | Occam's Razor |
Measuring Running Speed ? | Beating the Gun | Peak Speed
Limit | Wind Assistance | |
||||||||||||||||||||||||||||||||||||||||||||||||||||||||||||||||
90 Years of RecordsIs there a limit to how fast a man can run ?Take a look at the world record times for the men's 100 m sprint from 1912 to 2002.
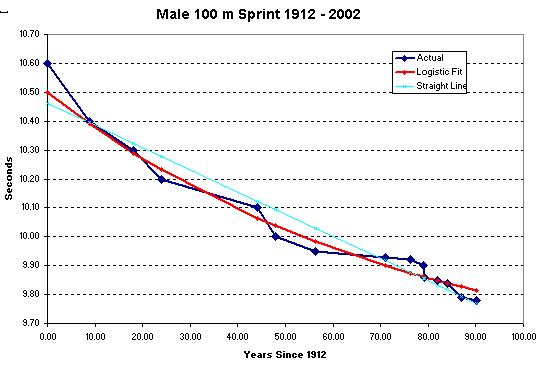
Table 1 - 100 m Sprint Records The record is being improved in ever-decreasing changes. Montgomery has become world record holder by improving the mark by barely 1 part in 1000 - and you have to wonder whether the dimensions of the track and measurement of atheletes performance is really that accurate (particularly when the effect of wind swirls etc.,. is considered, notwithstanding rules etc.,. relating to wind assistance). If the data is taken at face value, the following graph shows the reduction in speed improvements clearly...
Figure 1 - History of the 100 m Sprint Record
v Time
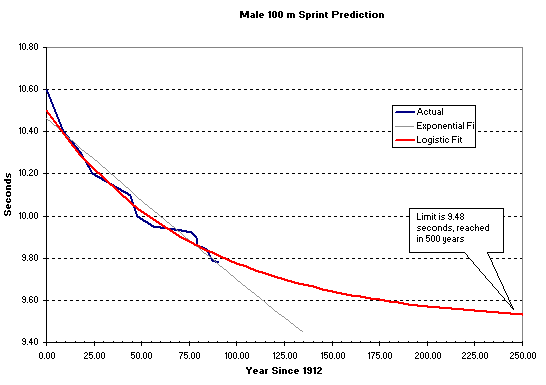
The dark blue line connects the individual record data points. A straight line fit to this is shown in the light blue line in Figure 1 above. This linear regression least-square error best-fit line over 90 years shows a slope of 7.7 millisecond fall per year. The correlation is 0.97, which is considered good for some applications (a best fit exponential gives virtually identical results). Even if this straight line trend were correct, it would imply that in about 1300 years, the 100 m record would be run literally in no time flat (the record would be 0 seconds). This should be challenged. The data over the last 90 years does not suggest the record will continue to fall as it did in the first 40 years to 1950. There are noticeable mismatches in the data, and the relationship over the first 20 years looks to have a different slope, to the middle 20 to 50 years and then the last 20 years. A better correlation can be achieved by using a logistic equation to fit the data. The logistic equation is very useful for modelling processes that reach a limit (see detailed discussion below). The correlation between the best least-square error logistic fit and the record data is 0.99 (1 is perfect fit). Although not a perfect match, it is a better statistical match than the straight line. The mean square error is 0.001452 seconds - or just 47% of that for the straight line. The logistic equation reaches a limit : 9.48 seconds. Shown below is the logistic model for the 250 years from 1912 to 2162.
Figure 2 - Future of the 100 m Sprint Record
?
It should be noted that in 1912, they didn't have running spikes, they didn't have starting blocks, and they didn't have all weather polyurethane tracks - all of which probably have contributed to a lowering of 100 m times. Hand-timing is often believed to have decreased recorded times (due to enthusiastic anticipation of the finish) - although some coaches claim professionally trained hand-timers were not susceptible to this. Quite simply, the contribution of these factors can not be ascertained - because we weren't there with the better technology. So the best that can be done is to consider the overall result of the technological and biomechanical progress.. The assumption is that whatever processes resulted in the improvement each would also one day reach a limit. There is a limit to technological as well as biomechanical progress. Patrick JohnsonAustralians got very interested in the 100 m Sprint in the week ending Sat 10th May 2003, when Patrick Johnson ran an Australian record of 9.93 secs (with 1.3 m/s wind assistance) on 6th May at Mito, Japan, and followed up on 10th with a 10.05 sec run (-0.3 m/s wind) in coming second to Tim Montgomery at Osaka, Japan. What will it take for Montgomery to match his world record - and someone like Johnson from Torres-Strait Islander and Irish stock beat it ? See discussion below about wind effects for some clues (Jonas Mureika's (Wind and Altitude adjustment calculator suggests Johnson's two May efforts were equivalent to corrected times of 10.02 (Mito) and 10.03 (Osaka)), but to really know the answer to who is the faster man you might have to look at 10 m splits for their races... Trending Average Top PerformancesFormer Canadian track coach Charlie Francis suggested that averages of the top 10 and top 20 performances for each year since 1991 might be a better indicator of performance trends. now inaccessible http://www.charliefrancis.com/community/viewthread.php?tid=1483, Charlie Francis discussion forum topic "9.48 in 500 years" Francis was Ben Johnson's coach at the time of his disqualification in the 1988 Seoul Olympics 100 m final, and was subsequently banned from coaching Canadian athletes. 1991 brought the arrival of Mondo Super X track, which might also have boosted performance (all-weather rubberised track with re-designed spikes that compress rather than dig into the track surface). Looking at the average of the top performers shows that either performances are approaching a limit, or might have even gone through a slight up-turn. Is this the effect of better drug-testing ? As the analysis on the Comparison of 100 m Sprinting page suggests, the limit is very near and might have been reached. Low Sub-10 Sprints in 2003 presents a map of the sub-10 performances since 1987, and provides further evidence of a slow-down in performances. Predictions of LimitsOther authors have predicted limits to performance. An ultimate limit of 9.37 sec is predicted by F. Péronnet and G. Thibault in``Mathematical analysis of running performance and world running records'', Journal of Applied Physiology, v.67, pp. 453-465 (1989) as cited in Jonas Mereika's paper "How Good Can We Get? Using mathematical models to predict the future of athletics" (published Athletics: Canada's National Track and Field / Running Magazine (April/May 1998)). Peronnet & Thibault's prediction of 9.73 s for Year 2000, however, has proven optimistic by about 0.06 secs; the record is not falling as quickly as they predicted, and the higher limit suggested above might be more accurate. According to claims on the Charlie Francis discussion forums,
Biomechanist Gideon B. Ariel Ph.D may have hypothesized in the late
'70's that .: 9.60 would be the limit of the human body
mechanically, that to exert the forces and limb velocites necesary
to exceed this would crack bones and pull tendon from connection
points. No Limits to Performance ?Some sports physiologists are more optimistic than this. For an intesting discussion prior to the Year 2000 Sydney Olympics, see W G Hopkins report in Sports Science Limits to Performance, and particularly the responses from Norway's Assoc Prof Stephen Seiler. Seiler reports I want to find out if we seem to be pushing the limits of human performance. Certainly people keep breaking world records. But are we getting to the point where training techniques are so good that it's only a matter of time before we top out -- before performance become essentially static, with only the occasional, once-every-generation super athlete able to set new records? Are we actually in a situation like that today with some sports? What we found out when we looked at the 100 meter dash for men was that the average performance improvement was 0.01 second per year [~1% per decade] based on world championship and Olympic finals performances (average time of top 6 finalists) since 56 (corrected for wind and altitude). This improvement was linear and showed no sign of leveling off as of the end of the 20th century. Obviously, limits are being approached, but I think we can expect similar "steady" improvements for the next several decades. For example, Michael Johnson's "statistical outlier" 200 meter time in 1996 demonstrates that the potential for substantial improvements is still there (the women's data was much more complicated and I will leave it at that for the purpose of this discussion). The world record progression in many events is marked by these stochastic jumps, stabilization at a new level, new jump etc. Seiler's fit of a straight line uses data only since 1956, and averages top performances not the peak performance (selecting performances at particular world-class events). Unfortunately, Seiler has not reported the goodness of fit in this discussion ( maybe he has in other publications). His method may be difficult, if not impossible, to extend back in time due to timing and recording inaccuracies. Other articles by Seiler at the site suggest he may have used film or videotape of performances to correct for hand-timing inaccuracies, and finding suitable archival material more than 50 years old could be impossible.
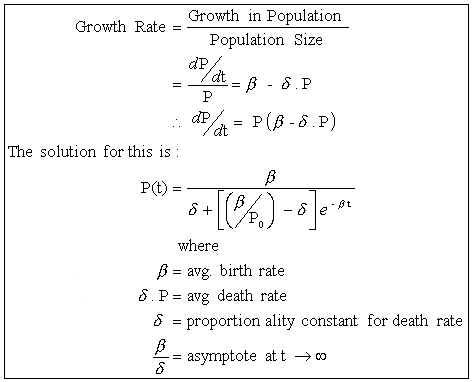
One should not increase, beyond what is necessary, the number of entities required to explain anything. From the discussion of Occam's Razor on Principia Cybernetica Web: Though the principle may seem rather trivial, it is essential for model building because of what is known as the "underdetermination of theories by data". For a given set of observations or data, there is always an infinite number of possible models explaining those same data. This is because a model normally represents an infinite number of possible cases, of which the observed cases are only a finite subset. The non-observed cases are inferred by postulating general rules covering both actual and potential observations. For example, through two data points in a diagram you can always draw a straight line, and induce that all further observations will lie on that line. However, you could also draw an infinite variety of the most complicated curves passing through those same two points, and these curves would fit the empirical data just as well. Only Occam's razor would in this case guide you in choosing the "straight" (i.e. linear) relation as best candidate model. A similar reasoning can be made for n data points lying in any kind of distribution. ...In mathematical modelling of systems, the principle can be made more concrete in the form of the principle of uncertainty maximization: from your data, induce that model which minimizes the number of additional assumptions. If Seiler's model makes subjective assumptions about what is treated as a world class event for the purpose of constructing his statistics and how many performances to include (top 6, why not top 4, 8, 10 etc.,.), then it might not be minimizing the number of additional assumptions. The discussion Hopkins reviewed includes viewpoints that there is no limit to performance. It raises such prospects as using gene therapy to insert the right muscle types into athletes, boosting their capacity. At what point ligaments, cartilage and perhaps even bones, give way and prevent a zero-second 100 m sprint is not clear - but with rewards for elite athletes sky-rocketing the temptation will obviously be there for some sportsmen to be willing guinea pigs. Measuring Running Speed ?Up until the 1968 Mexico Olympics, the 100 m sprint was hand-measured with stop-watches calibrated in tenths of seconds. So, as can be seen in Figure 1 above, the record fell in 0.1 second increments. Part of the inherent inaccuracy in this was the error due to the reaction time of the human timers. This could be between 0.1 and 0.2 seconds on starting and stopping, could vary between starting and stopping, and could vary compared to the runner's reaction to the gun. Measuring records in 0.1 second increments at least recognised the limited accuracy of the process. For the 1968 Mexico Olympics, Jim Hines had several advantages: 0.01 second timing (allowing a new record just 0.05 seconds faster than the previous, and high altitude (equivalent to a 1.5 m/s wind assist, added to the 1.6 m/sec actual wind assistance). It's difficult to say how much of the improvement in his time may have been due simply to timing artefacts. Hines record stood for 15 years until Calvin Smith beat it in 1983 by just 0.02 seconds. That margin is so fine that if a light (eg. a LED) was flashed on for 0.02 seconds nobody would see it. Some researchers have estimated the effect of altitude, and wind-assistance. J.R.Mereika's paper "A Matter of Time" (Published: Athletics: Canada's National Track and Field / Running Magazine (December 1999)) has estimated that the results could vary by as much as 0.18 second for the differing extremes of wind assistance (up to 2 m/sec) and altitude effects. The 0.18 seconds is nearly enough to cover all the improvement in the record for the last two decades! The difference between no wind and 2 m/sec wind assistance could amount to around 0.1 seconds. Records that split this difference (by measuring to better than 0.1 sec resolution) could simply be measuring the varying contribution of wind. Tim Montgomery's 2002 record had the maximum legal wind assistance of 2 m/sec. Don't think a 1 m/s wind can mess much with an 80 kg sprinter ? Think about this fact: a 390,000 kg 747 takes off with a 320 km/hr wind across its wings - that's about 90 m/s. Clearly, just being heavy or fast doesn't mean wind has no effect. An average sprinter is 5000 times lighter than the 747, and a 5000 times lighter wind would be 0.02 m/s. If sprinters were as aerodynamically efficient like a jumbo wing, they'd be literally flying at their peak speeds of close to 12 m/s (well over 0.02 m/s). Thanks to poorer aerodynamics (and lack of smooth laminar flow), they don't fly - but aerodynamic effects can still drag them back. For more convincing evidence, watch TV footage showin how an approaching hurricane can blow grown men off their feet and into the air. Beating the Gun or Running FastIt is equally revealing to consider the effect of the start, and particularly the reaction time of the runners. The reaction time is the time is takes for the runner to respond to the start signal and begin leaving the starting blocks. (see Omega and Sport - Athletics for a good run-down of the sprint timing and start rules). Interestingly, it is considered that there is a limit to how fast a human can react to a start signal. As of 2002, if an athlete left the blocks sooner than 100 mSec after the start signal, he was deemed to have false-started. The best athletes reaction times are usually in the range of 120 mSec to 160 mSec (see graphs). If you track individuals performances, there is usually a spread of 0.01 to 0.03 s in their reaction times. Until someone can consistently start in the same time (with less than 0.01 second variatin), it's fair to question what it means when events are timed in 0.01 second increments. At least some of the difference between world records and world class performances might have more to do with luck than something that can be honed by good training. See Reaction Times and Sprint False Starts for more discussion of reaction times. Peak SpeedFurther insight can be gained by looking at the quickest 10 metre split attained by the runners - this shows the peak average speed reached. In 1988, with 1.1 m/sec wind assistance, Carl Lewis and the drug-fuelled Ben Johnson both hit a 0.83 sec split - or 12.08 m/sec ( = 43.37 km/hr). Lewis hit the same mark again in his Tokyo 91 world record run with 1.2 m/sec wind assistance. Maurice Greene's Athens 97 record, with a mere 0.2 m/sec wind assistance, could manage only a 0.85 split. In Seville 1999, Greene managed a 0.84 with a 0.2 m/sec wind assist, as did Dwain Chambers. Tim Montgomery's 2002 record run matched the 0.83 sec split, with 2m/sec wind assist (see Track And Field, Nov 2002). But over nearly 14 years, the peak speed has not been improved unless an allowance is made for wind assistance (making Greene's 99 performance perhaps the best).. This could be a strong signal that a limit has been reached. Wind AssistanceWhen you get down to looking at one part in 100 changes to split times, it is wise to question what the wind-assistance figure represents. This has been researched by N.P Linthorne who reports(while with the University of Sydney School of Exercise and Sports Science): Accuracy of Wind Readings In the sprint events, races are timed to the nearest 0.01 seconds and the official wind reading is a 10 second measurement obtained from a single wind gauge placed next to the track. My wind assistance study indicated that if athletes are to be treated fairly when recognising world records the official wind reading must be accurate to ±0.2 m/s. It has long been suspected that the official wind reading does not always provide an accurate representation of the wind affecting the athlete as they run down the track. A study of wind conditions at the Sydney Athletic Centre showed that the accuracy of the official wind reading is only about ±0.9 m/s. This is equivalent to an accuracy in race time of about 0.05 seconds. Therefore, the occasional injustice may arise in the recognition of world records. The accuracy of the official wind reading could be improved to the required level by using several wind gauges placed along both sides of the 100m straight. An instantaneous wind measurement would be taken as the runners passed by each wind gauge. However, this approach would greatly increase the cost and complexity of organising an event that meets the requirements for consideration of world records. As Linthorne suggests, gusts and swirls at fortunate parts of the track could be affecting the results. The wind guage is required to have an accuracy of only 1 part in 10 (relative to the 2 m/sec limit being measured) - nothing like the 1 part in 1000 reported timing accuracy. Inaccuracy of 0.05 seconds could account for virtually all the difference between the last three world records (9.84 to 9.78 seconds). Most of the recent improvement in the record has been due to improved reaction times (as shown for the Carl Lewis case above).. Is it really a record run, or just a record start ? If the improvement is purely due to luck or flukes in beating the gun, then what's the record worth ? What if it's just random wind gusts ? The change in the starting rules may make gambling on fast-starts less likely and beating the records could be difficult without this advantage. If the 100 mSec false-start limit is reduced, and new records arise, will they be due to a genuine improvement in performance, or just good-luck in beating the gun ? How long will it be before anyone runs faster than Carl Lewis's 0.83 s split from 1988 ? What effect will the April 2003 revelations of Carl Lewis and other American athletes positive drug tests have, if any ? Lewis was found to have tested positive to the stimulant ephedrine in the US trials in 1988. Is that how sprinters improve reaction times ? The Comparing 100 m Sprinting - Wind & Altitude Correction page shows how correction for wind and altitude might affect rankings, and can also be useful in eliminating some of the variability in trends in average top performances. Racehorse LimitsThoroughbred Race Horses are the product of over 300 years of selective breeding. Today, racehorse records remain much the same as they were 100 years ago. As an example, Erica Goode reports (New York Times 8th May 2001, "Thoroughbreds Face Physical Limits to Improvement"): The winning times for horses in classic races like the Kentucky Derby have remained surprisingly static. Secretariat's world-record-breaking Derby time of 1:59.25, for example, set in 1973, remains unsurpassed more than a quarter of a century later. Monarchos, this year's Derby winner, clocked the second-fastest winning time in history, running the race in 1:59.97, but still did not break Secretariat's record. The reasons, scientists say, may have to do both with the unique physiology of the horse and the nature of the sport. Horses are designed to run, their fleetness of foot having evolved over millions of years as a strategy of escape from predators. At one hour old, a foal is on its feet; at two hours, it is ready to go. And the horse's natural running ability has been nurtured and enhanced in thoroughbreds, which have been selectively bred for racing since the 17th century. So while people require years of training and daily practice, thoroughbred racehorses enter the world much closer to their performance limits, said Dr. James Rooney, an emeritus professor at the University of Kentucky and an expert on equine biomechanics. "The human is not, from the point of view of construction, a particularly good thing to start with and be an athlete," Dr. Rooney said. "But the horse is born to be an athlete. And the more they learn about horse physiology, the more people begin to realize that this animal has evolved to a certain point and you can't change it very much." Lest you gather from this that Thoroughbreds have reached perfection, Loren Bolinger's 1998 article On the Manipulation of the Gene Pool What's Best for the Thoroughbred? -A Human Conceit, (once at "http://www.sunshow.com/pool.html"), gone by 2004)" raises a number of shortfalls in the history of thoroughbred breeding. This include a reluctance to incorporate female bloodlines until recent times, and disastrous destructive inbreeding. These mistakes and shortfalls lead to Loren's question on the wisdom of genetic manipulation: The altruistic or otherwise tampering with the breed by latter-day well-meaning horsemen with that most noble of mankind's biological creations, the Thoroughbred horse, has largely been ill-advised, ill-conceived, and fortunately, historically relatively meaningless... Even with current advancements in molecular cyto-genetics, can we be sure we are as wise as Mother Nature? It would be a naive arrogance and a conceit to respond too quickly with an all-knowing yes. Be assured there are plenty of mysteries left to confound us. Are we so sure of ourselves or so smart to want to attempt to manipulate the gene pool of the Thoroughbred on any large scale? If such were the case, for what factors would we select - would we be wise enough to know beyond reasonable doubt the correctness of our decisions for the future of the breed? It does not seem reasonable to expect human performance to improve forever and ever, when it's clear that human efforts - including selective breeding over hundreds of years - has not been able to achieve that for racehorses - does it ? Have we learned enough from the mistakes in thoroughbred selective breeding to not make even more disastrous mistakes with human athletic inbreeding ? Today's panacea, Genetic manipulation, may turn out to be hi-tech snake oil. Interestingly, thoroughbreds continue to be raced while records no longer fall. Financial support for genetic manipulation of horses was so little that researchers have had great difficulty in funding the Horse Genome Project. The horse racing industry is not convinced of its potential benefits. Racing is about competition - which is beating the other horse, not necessarily winning world records. Thoroughbread racing is also a lot about gambling, and that doesn't require record-breaking. Eventually, the human 100 m sprint will get to that ! Mathematics of Logistic EquationFor there to be a performance limit, we need the Performance P(t) function to reach a limit at some future time - with no further change. The objective function is then: dP/dt = 0 ...(1) There clearly has to be a limit - even if it is the no-time-flat value of Plimit(t®¥) = 0. We don't know what sort of function to use for dP/dt. Let's postulate that it might be some function of the current performance level (so that we can use current performance to predict future performance): dP/dt = f(P) = 0 ...(2) The Taylor series expansion of any function f(P) gives: dP/dt = bP + dP2 + gP3 + .... ...(3) Let's take to equation 3 with Occam's Razor. Using one term of the taylor series expansion for f(P) gives an exponentially increasing performance - and can't satisfy the objective (1) of reaching a limit (except for the trivial case of b = 0, which implies no change at all) Taking the first two terms of the taylor series expansion is the simplest approximation to f(P) that will permit a non-trivial solution to (1). dP/dt = bP + dP2 ...(4) Solving (2) and (4) gives 0 = Plimit ( b + dPlimit ) hence b + dPlimit= 0 Plimit = - b /d ...(5a) ( Since Plimit >= 0 we would expect that b >= 0 and d <= 0 in equation (9). ) The solution to the differential equation in (4) is given is
Summary: The logistic equation is the simplest mathematical model that captures a process of change that reaches a limit. Applications of Logistic EquationThe Solver feature of Microsoft Excel can be used to to fit data to the solution to (4). Instructions for this can be found on further discussion of the Logistic Equation, which includes application to fitting Australia's population growth and links to applications to airport growth modelling. Updated Airport Growth for Sydney Airports shows how well the logistic model has predicted growth at Sydney's KSA airport (in comparison with exponential estimates and experts' guesses). An in depth discussion of modelling the growth of foot and mouth disease with a logistic equation can be found here. For application of logistic equations to the 2003 SARS epidemics in Hong Kong, Singapore and Canada see Forecasting SARS. |
||||||||||||||||||||||||||||||||||||||||||||||||||||||||||||||||
Published Sept 2000 First published 21st September, 2002,
Last Revision: relocated to new web host, links updated, 25th Jan 2017 |

 Seiler's methodologies are impressively complex. Does this
complexity, however, go beyond what
Seiler's methodologies are impressively complex. Does this
complexity, however, go beyond what