|
||||
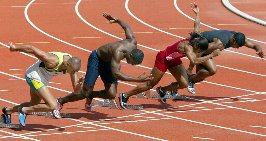
Beating the Gun or Running FastAthletics sprint events begin with a sequence of events:
When athletics sprint events separate athletes and world records by hundredths of a second, its worth appreciating the magnitude of the start events and particularly to consider their impact on timing accuracy. Reaction TimeThe reaction time is the time is takes for the runner to respond to the start signal and begin leaving the starting blocks. (see Omega and Sport - Athletics for a good run-down of the sprint timing and start rules). IAAF policies consider that there is a limit to how fast a human can react to a start signal. As of 2002, if an athlete left the blocks sooner than 100 mSec after the start signal, he was deemed to have false-started. Some fans think this is wrong and that any reaction after the gun should be allowed. Propagation DelaysIf the athletes ears are 2m from a speaker emitting the sound of the gun, the sound will travel at approximately 330 m/sec and hence not even arrive at his ears for 0.006 seconds. If the athlete's ear is say 20m from a cap-pistol, the sound will take 0.061 seconds to reach his ears. If you are sitting in the crowd, say 60 m from the starter, the sound won't reach you until 0.182 seconds after the gun. Most athletes will in fact be on their way by the time you hear it. Because light travels at 300 x 106m/sec and reaches you in 200 nanoseconds, you will see the athletes move noticeably before you hear the gun (ignoring the small difference in reaction time to visual and auditory stimuli that you are likely to have).Someone standing on the finish line, 100m away, won't hear the gun until 0.303 seconds after the start. He might see a puff of smoke from the starter's pistol just 0.270 seconds after the gun. Hand-timers were trained to react to the smoke signal. An athlete in Lane 8 is about 8.5 m from one in Lane 1. Sound will take 0.026 seconds to reach lane 8. If the starter's gun was a further 10m from lane 1, the delay would blow out to 0.052 seconds. IAAF world championships since 1995, but not the 2000 Sydney Olympics, have used silent guns to overcome this - the "bang" of the gun is sounded only in the speakers behind each starting block. You need to be careful comparing the peformance of someone in the Sydney Olympics with those at recent World Championship. Some of the difference in the second decimal digit reported for Sydney races is measurement error. Same goes for comparing recent races with pre-1995 results - up to 0.05 seconds of the last decade's improvement in the 100m sprint record could be attributable to more accurate timing rather than athlete's performance. Once the sound has reached the athletes ears, his brain has to command muscles to respond. The conduction speed of signals in the brain is about 100 m/sec, and in the central nervous system falls to about 70 m/sec. Just getting the signal from the brain to the feet could take 0.026 seconds (assuming you are 1.8 m tall). As will be seen below, there is also a very substantial delay in recognising the sound of the gun... Best Reaction TimesThe best athletes reaction times are usually in the range of 120 mSec (0.12 sec) to 160 mSec (see graphs below). Tim Montgomery improved that to a near perfect 104 mSec - and came very very close to being false-started. The only sprinter to get closer to perfection was Surin Bruny - who managed a 101 mSec in a the 1999 WC 2nd semi-final . Burrell's 1991 world record began with a reaction time of just 117 mSec. In the same race, Carl Lewis reacted in a snail's-pace 166 mSec, probably because he'd deliberately slowed his start due to having an earlier false-start posted against him (this put him at risk of disqualification if he false-started again). Taking away reaction time, Burrell covered the 100 metres in 9.783 seconds, Lewis in 9.764. Lewis was actually the faster runner, but Burrell was the better "gunner". In Rome (1987) Carl Lewis' reaction time was 193 mSec for a 9.93 sec run. By Seoul 1988, it was 136 mSec for his 9.92 sec run against Ben Johnsons' 9.79 (Johnson was disqualified for drug positive test), in Tokyo (1991) it was 140 mSec for his World Record 9.86 run. Lewis's 1991 run was 70 mS faster than his 1987 result, and 50 mSec of that improvement was the reduction in start reaction time the other 20 mSec could have been wind or other climatic factors! (source data: http://isb.ri.ccf.org/biomch-l/archives/biomch-l-1997-12/00046.html Biomechanics and Movement Science listserver discussion response by J R Mereika (retreived from internet archive to this pdf ) or see also Mereika's page 10 sec split data - Men's 100m (was http://desert.jsd.claremont.edu/%7Enewt/track/splits/splits.html#87wc) retreived from internet archieve to this pdf); Not surprisingly, in the ten years after 1991, false-starts have became de-rigeur in 100 m sprints. Athletes were prepared to gamble on beating the gun. Given how much margin in 100m times can be attributed to reaction time, erring on the side of a false-start was a gamble worth taking. In reaction to the problem of excessive false-starts, the IAAF has modified the rules so that from Feb 2003, the second runner to false-start will be disqualified (regardless of who it was that first false-started. a rule similar to that now applying in swimming) - see BBC report "Sprint Rule Well Received" Jan 16 2003.. Getting a lucky-start, or psyching your opponents out of a quick-start, can make all the difference it takes to get a world record or olympic medal. But with the new rule, if someone false-starts, the gun anticipators are likely to "pull-back" and races could then be run in slower times. A Literature Review on Reaction Time (by Robert J. Kosinski Clemson University) states: For about 120 years, the accepted figures for mean simple reaction times for college-age individuals have been about 190 ms (0.19 sec) for light stimuli and about 160 ms for sound stimuli (Galton, 1899; Fieandt et al., 1956; Welford, 1980; Brebner and Welford, 1980). Elite 100 m sprinters are way above the mean in at least running performance, but their mean reaction times are not much better than the average. For example, in the July 12 2003 Rome Golden League A & B Series 100m sprints, reaction times averaged 153 mS (standard deviation 28 mS) - the minimum was 110 mS, max was 242 mS; there was virtually no correlation between running time and reaction time (r2=0.02).
Figure 1 - Reaction Time v's
Sprint
Time
If reaction time could be "trained for", there ought to be a correlation between faster running times and reaction times (and all points should lie close to the trendline in Fig 1 above). Psychologists carrying out simple reaction time experiments use very large repetitions because of the wide random variation in most test subject's performance. If these are random and can not be trained out - why not discount them from the overall running times or agree that any times that come down to the second decimal place are equivalent ? 2003 World Championship Dummy SpitThe 2003 IAAF World Championships in Paris saw American Jon Drummond disqualified in his heat of the Men's 100m for leaving the blocks in 0.053 seconds after the gun. Asafa Powell, who's 10.02 time in the heats was not bettered at any time during the Paris event, broke slightly later in 0.086 seconds and was also DQ'd. Drummmond put on a disgraceful performance lying down and refusing to leave the track for nearly 20 minutes. He showed no respect for his fellow athletes and the distraction he caused to them, as it delayed the event for over an hour. Drummond's disqualification produced some
lively debates from
those eager to defend him and suggest the IAAF
rule was wrong. An
excellent example of the debate was the Track
& Field Forum's
Reaction
Times discussion from December 2003. The October 2003 edition of Track & Field magazine published graphs of the pressure plate readings from Drummond's heat (see online version, pdf saved from internet archive).
Track & Field defends Drummond on the basis that he had not begun his power drive before the 0.1 sec limit (and only just crosses the detection threshold at 0.052 seconds). But if you look at the point each athlete has zero pressure on the blocks (look at the trailing edge of the pressure graph), Drummond is out before everyone except Powell (who was also disqualified for breaking). The pressure graphs also put the reaction times in context. Each athlete takes around 0.3 seconds between the leading edge of his drive off the blocks, and the time he is clear of the blocks. Getting out of the blocks takes the sprinter 30 times the difference in the last two world records. There is much to be gained by getting out earlier than the field, as Drummond appeared to do. Notwithstanding that, there appears to be considerable latitude in the IAAF rules relating to the false start mechanism - leaving much up to the IAAF officials as to what it deems approved. This is discussed in detail by rival manufacturer FinishLynx in a USTCA article. While the Seiko gear pulled Drummond up because he simply crossed a 25 kg threshold, more sophisticated processing aimed at detecting an ongoing rising edge may have let him go. If Drummond had honed his starts by training on more forgiving equipment, it might explain some of his conviction in Paris that he had not false started. Many track fans sympathetic to Drummond claimed the TV coverage didn't show any movement. But NTSC TV images sample movement only 30 times per second - so each frame is 0.033 seconds apart. The wobbles in Drummonds pressure plate have a period of around 0.12 seconds; the television sampling rate is simply not high enough to measure Drummonds movement (while it is more than the Nyquist sampling minimum, it's not a sufficient multiple of the Nyquist sampling rate to provide a convincing indication - even if you stop-frame and analyse each frame). Reaction Time Scatter GraphFor those having difficulty understanding the science in the 0.100 second false-start threshold, here is a scatter graph of the reaction times of the finalists in the last four IAAF World Championship events. The best straight line fit suggests a slight relationship between reaction time and 100m sprint times, but the correlation of 0.10 indicates the fit is very, very poor. If reaction times could be trained for (and were significantly better for sprinters than more ordinary folk), you'd see a much stronger correlation (0.80 or more - a correlation of 1.00 is a perfectly exact fit). Figure 2 - World Champions Reaction Time v's Sprint Time It is fairly clear that reaction times are mostly in a 0.13 to 0.15 band. There are other variations between the 4 World Championship races that may have made the correlation slightly better than in the Figure 1 event. For example, different degrees of wind assistance and altitude. Any larger sample would be weakened by this effect. There may also be more outliers due to injury in larger sample sizes (assuming brain reaction processes aren't likely to be injury or fatigue affected).
Figure 3 - WC Final and Semi-Finalist Reaction Times It is likely that in the semi-finals, the best athletes are saving themselves for the final and aren't running flat out. That probably accounts for the extra spread. But there is no reason to think that their reaction times are unrepresentative of their potential - unlike running through pain barriers or risking injury from over-exertion, reacting quickly in a semi is unlikely to diminish your performance in the next days final. Of course, if there is some legal or marginally legal stimulant that might help you get out quick, you might not want to take it for a semi and would keep it in the kitbag til the final I nearly said "Hi Kelli", but as Figure 6 below shows, she looked like she did have narcolepsy on the blocks. Whatever she took didn't have much affect on her start reaction. Figure 4 below shows a cumulative distribution of the percentage of sprinters having reaction times below particular values, using the same data as Figure 5. The reaction time corresponding to 50% is the average reaction time, and the idea of the graph is to show the spread of the distribution. There is some clustering of values at 0.12 and 0.13 reaction times, due to the results only being reported to 2 decimal places.
Figure 4 - Cumulative Distribution of Reaction Time
Figure 5 - 2003 World
Championship Mens 100m
Final and Semi Finals
The average reaction time is 0.156 (standard deviation 0.026), compared to 0.145 for 1997-2003 (std dev 0.022). While the final was the slowest since 1983, the start reaction times were still pretty fly. The difference of 0.011 in the average could be partly attributed to having truncation errors in the 1997. Hence the closeness of the average reaction time suggests there hasn't been any material slowing down in the start process due to the new false start rules. In the last 4 WC SF & F, Frank Fredicks averages 0.12 for two appearances, and Surin Bruny averages 0.132 for 5 appearances (2 below 0.13, one being the 0.101 lowest legal reaction time), Green gets two below 0.13 but averages 0.134 for 6 appearances, Boldon averages 0.138 for 5 appearances (2 below 0.13); nobody gets below 0.13 and makes more than 1 appearance in the list. The best in this list - Fredericks - was one of those DQed in semis, and next best Bruny couldn't repeat anything close to his best result. Their average performances and spread of results suggest they were anticipating - not trained to do it repeatably. Most elite sprinters have a spread of 0.02 seconds or more in their reaction times. That's about one part in 6, and twice the margin between the last 2 world records. But elite sprinters 100m sprint times rarely vary by more than 0.1 seconds in 10.1 - that's one part in 100. They are able to control their sprint time with 10 times the relative error of the reaction time. If reaction time is a trained response, why isn't it repeatable with less variance ? It obviously includes some random errors and is not strongly controllable. It looks quite unlikely that a reaction time less than 0.12 seconds is repeatable and hence the result of good training or a freakish natural ability. Auditory Evoked PotentialsThere is substantial grounds that the 0.1 second rule is very reasonable.Auditory Evoked Potentials are the brainwaves that can be measured to show how quickly subjects respond to sound stimulus (see What are Auditory Evoked Potentials, was from http://audiospeech.ubc.ca/haplab/aep.htm) . After a sound stimulus, an evoked potential from the inner ear has to travel to the brainstem (10 to 15 mSec delay). Next, it can take up to 50 mSec to get passed from the brainstem to the auditory cortex. The auditory cortex then has to appreciate and respond to this. The "slow" cortical auditory ERPs appear between 0.05 and 0.200 seconds later, with a large N1 event occuring between 0.08 and 0.100 seconds after the stimulus. It's unlikely that the sound event has been recognised and discriminated from background noise or could be acted upon until this N1 event (it still has to pass to the motor cortex, then get distributed via the much slower Central Nervous System to muscles). Neurophysiologists agree that to "hear" the sound thus takes around 80 to 100 mSec from the stimulus. The auditory ERP's are very close to visual evoked potential (retina to cortex) which is 70-120 msec. Neurophysiologists report that female EP's are on average about 10% faster than male's. There is possibly a physiological basis for women to be sharper. However, a quick look at the 2003 WC Womens 100m Semi-finals and finals shows the average reaction time to be 0.158 sec (std dev 0.027) - not significantly different to the mens 0.156. Even though the womens 100m times are nearly 800 mSec slower, they're not losing anything at the start. If womens EP's are theoretically faster, this is not getting translated into speed off the blocks. Interestingly, there was virtually no correlation between reaction time and sprint time (correlation r2=0.002). Here is the scatter diagram:
Figure 6 - Womens 100m
Sprint Reaction Times
2003 WC F & SF
All the meets discussed above have used silent gun starting. As discussed in the Did Sydney Blocks Rob Mo Greene Of Olympic Record? (Track & Field newsletter 2001, was http://www.trackandfieldnews.com/results/newsletter/200105/reaction_times.html, now defunct and not in internet archive), use of unsilenced guns in the 2000 Sydney Olympics cost gun reactors up to 0.05 seconds - and rewarded the gun anticipators by allowing them to play with a 0.05 larger margin above the 0.100 threshold If athletes were able to see and react to the gun smoke, there might not have been this sound-delay disadvantage. But maybe watching for smoke would need your head up in the wrong position for a good start and defeats the end of getting away faster. ConclusionThere are physical limits to how fast an athlete can react to the starters' gun. While the official IAAF rules set a limit of 0.100 seconds, it's likely that anyone reacting in less than 0.120 seconds has anticipated the gun.The new false start rules introduced in Jan 2003 have raised the stakes for those who want to gamble on anticipating the gun. This saw two high profile athletes watch the World Championship 100m from the sidelines, after their disqualification under the new rules. Nevertheless, the reaction times, and the individual variations in it, can easily swamp the margins by which the world record has been improved in recent years. Timing methods used at the Sydney 2000 Olympics recorded events to 2 decimal places, but didn't match the accuracy standards in use at IAAF world championship events. The flaws may well have prevented Maurice Greene setting a world record that would still stand at the end of 2003. At least at Sydney 2000, the second decimal digit did not have the same significance as at the world championship. And Greene lost a world record to Montgomery's Sep 2002 wind and luck assisted 9.78 run. Perhaps its reasonable to question whether, more generally, the second decimal digit ever does represent something that an athlete has control over. When records get down to improving only the second decimal digits (hundredths of a second), they are likely to be largely a matter of luck or being able to persist long enough until luck comes your way.
First published 21st
September, 2002, Last Revised 25th Jan 2017,
relocated to new host, dead links removed,
internet archive pdf substituted where possibl.
|