
As of 1st July, there had been only 2 sub 10 second runs in 2003. For the last decade, the gold standard for a good 100 m run was a run in under 10 seconds. How untypical is 2003 ? Is it just because the good runners save their best until the end of the European running season (or the world Championships in late summer ?).
This can be decided by looking at how sub-10 runs have occurred as each season has progressed. If athletes improve their times as the season progresses, there will be a rising number of sub-10 runs as the months click by.
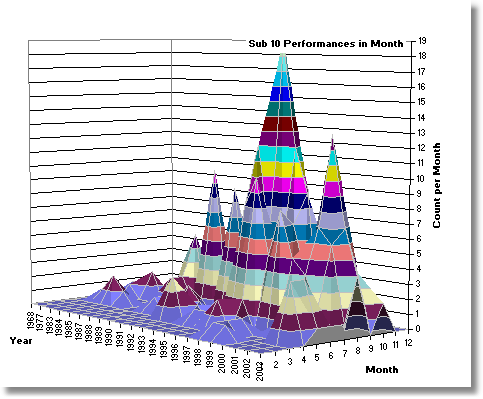
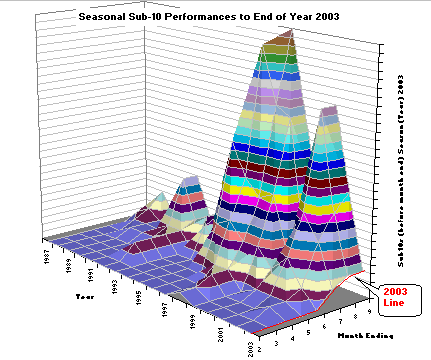
Fig 1 below is a 3D plot of the accumulated number of sub-10 sprints that occurred as the months of each season pass.
This 3D plot is like a topographic map, the years are plotted (say) in the North-South direction, months in the East-West, and the height is the total of sub-10 runs so far in a given year.
The animation shows a 3D surface developing as each year steps from 1987 to end of 2003 - with the surface bulldozed down to zero for unplotted (future) years
The surface in Fig 1 can be looked at from different angles...
A static version is shown as Fig 5 below.
Fig 1 uses raw data from IAAF results lists for best ever 100 m runs. It makes it clear that more sub-10 runs happen in the back 3 months of the season, but in most years you can expect to see quite a few sub-10 runs by the end of June (30% of sub-10 runs occur before end of June). Year 2003 was very untypical - you have to go back to 1995 to see a season with 2 or fewer sub-10 runs at the end-of-June mark. By end of 2003, there were only 9 sub-10 runs, still fewer than any season since 1995.
Fig 8 below is similar to Fig 1, but uses data corrected for Wind and Altitude assistance using Jonas Mureika's wind and altitude correction calculator. Fig 8 also identifies the Olympic years. There is a stronger end-of-season effect (down to just 23% of sub-10's by end June), but you still have to back up 8 years to find a year as slow as 2003.
These graphs make it clear that by the end of June, the number of sub-10 runs will be a good indicator of how strong performances will end up in that year.
Uncorrected Data
Table 2 show the uncorrected sub-10 performances in each year listed according to the month of the year in which the run occurred. Fig 1 was based on Table 2. Uncorrected means no correction has been made for wind or altitude effects.
Each column of Table 2 shows the number of times registered below 10 seconds in a given month. Fig 3 is a 3D surface plot of Table 2.
In Table 4, these monthly counts are tallied so that each monthly column shows how many sub-10 runs had been recorded in the year to the end of the month. There are also 3D graphs of these tables.
It's clear from Table 4 and Fig 5 that more sub-10 runs occur in the "back-end" of the running season. Nevertheless, 29% of sub-10 runs have occurred by the end of June (the "front-end" of the season).
If you look carefully at Table 2 or Figure 1, you will see that 2003 is an remarkably slow year At the end of July, there had been only 2 sub-10 runs. You have to go back 8 years to 1995 to find a year as slow as this.
Conclusion
Something is going on - 2003 is a unusually slow year for 100 m sprinting.
Could it be the new false start rules ? Maurice Green claimed it was the new false start rule (Associated Press, 10th July). But he ran 10.09 (-0.3 m/s wind) in Rome on July 11th, after a 0.141 s reaction time. Even if he shaved his reaction time to the perfect minimum legal 0.100 s reaction time, it'd still be a dissappointing 10.05 run.
Maybe something else is slowing down this year's contenders ?
Background
This page was created in response to a
discussion on the J Carriere's Sub-10 discussion forum (once was
http://www.jcarriere.com/Board/phpBB2/index.php, now gone)
titled
Sub
10 Performances 1998-2002 WHATS HAPPENING THIS SEASON?
If you want to see more strong evidence of the slowing down of 100m sprinters in recent years, see the trend of the top 10 and 20 sprints for the last 5 years.
The Tables and Graphs
| Table 2 - Number of Sub-10 Runs Each Month | Year | ||||||||||
| 1 | 2 | 3 | 4 | 5 | 6 | 7 | 8 | 9 | 10 | Sum | |
| 1968 | 1 | 1 | |||||||||
| 1977 | 1 | 1 | |||||||||
| 1983 | 1 | 1 | 1 | 3 | |||||||
| 1984 | 2 | 2 | 4 | ||||||||
| 1985 | 1 | 1 | |||||||||
| 1987 | 1 | 1 | |||||||||
| 1988 | 2 | 2 | 5 | 9 | |||||||
| 1989 | 1 | 1 | 2 | ||||||||
| 1990 | 1 | 1 | 2 | ||||||||
| 1991 | 2 | 1 | 10 | 1 | 14 | ||||||
| 1992 | 3 | 1 | 2 | 6 | |||||||
| 1993 | 1 | 7 | 8 | ||||||||
| 1994 | 1 | 1 | 9 | 5 | 16 | ||||||
| 1995 | 1 | 1 | 1 | 1 | 1 | 5 | |||||
| 1996 | 2 | 1 | 8 | 12 | 2 | 25 | |||||
| 1997 | 2 | 10 | 6 | 19 | 1 | 38 | |||||
| 1998 | 1 | 1 | 1 | 5 | 5 | 12 | 9 | 34 | |||
| 1999 | 1 | 8 | 7 | 9 | 1 | 26 | |||||
| 2000 | 1 | 5 | 3 | 2 | 4 | 15 | |||||
| 2001 | 1 | 4 | 7 | 13 | 25 | ||||||
| 2002 | 4 | 4 | 2 | 6 | 7 | 4 | 27 | ||||
| 2003 | 1 | 1 | 1 | 4 | 2 | 9 | |||||
| Total | 2 | 1 | 12 | 16 | 50 | 61 | 99 | 28 | 3 | 272 | |
| % in Month | 1% | 0% | 4% | 6% | 18% | 22% | 36% | 10% | 1% | ||
and here is the 3D map of this table. Notice there are plenty of hills to mark sub-10 performances before end of June (6th month) in years before 2003.
Fig 3 - 3D Map of Monthly Sub-10 Performances
| Table 4 -Cumulative Number of Sub-10 Runs in Year to End of Month | Total | ||||||||||
| Year |
1 | 2 | 3 | 4 | 5 | 6 | 7 | 8 | 9 | 10 | Ever |
| 1968 | 1 | 1 | |||||||||
| 1977 | 1 | 1 | 1 | 2 | |||||||
| 1983 | 1 | 1 | 2 | 3 | 3 | 3 | 5 | ||||
| 1984 | 2 | 2 | 2 | 4 | 4 | 4 | 9 | ||||
| 1985 | 1 | 1 | 1 | 1 | 1 | 1 | 10 | ||||
| 1987 | 1 | 1 | 1 | 11 | |||||||
| 1988 | 2 | 4 | 9 | 9 | 20 | ||||||
| 1989 | 1 | 2 | 2 | 2 | 2 | 2 | 22 | ||||
| 1990 | 1 | 1 | 2 | 2 | 2 | 24 | |||||
| 1991 | 2 | 3 | 13 | 14 | 14 | 38 | |||||
| 1992 | 3 | 3 | 4 | 4 | 6 | 6 | 6 | 44 | |||
| 1993 | 1 | 1 | 1 | 8 | 8 | 8 | 52 | ||||
| 1994 | 1 | 1 | 2 | 11 | 16 | 16 | 16 | 68 | |||
| 1995 | 1 | 1 | 2 | 3 | 4 | 5 | 5 | 73 | |||
| 1996 | 2 | 3 | 11 | 23 | 23 | 25 | 25 | 98 | |||
| 1997 | 2 | 12 | 18 | 37 | 38 | 38 | 136 | ||||
| 1998 | 1 | 2 | 3 | 3 | 8 | 13 | 25 | 34 | 34 | 170 | |
| 1999 | 1 | 1 | 1 | 1 | 9 | 16 | 25 | 26 | 26 | 196 | |
| 2000 | 1 | 6 | 9 | 11 | 15 | 15 | 211 | ||||
| 2001 | 1 | 5 | 12 | 25 | 25 | 25 | 236 | ||||
| 2002 | 4 | 8 | 10 | 16 | 23 | 27 | 27 | 263 | |||
| 2003 | 1 | 2 | 3 | 7 | 7 | 9 | 272 | ||||
| 2 | 3 | 15 | 31 | 81 | 142 | 241 | 269 | 272 | |||
and here's the cumulative graph (pre 1987 has been removed, to make it clearer) The 3D surface makes the decline since the lofty heights of 1997 quite evident...
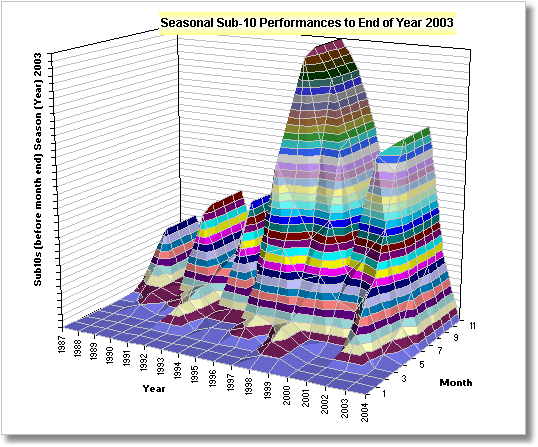
Notice that the ridge line for 2001 is not much below 2002. But Year 2000 is very much lower. Why did sprinters run slower in 2000 ? Did the Sydney Olympics drug-testing regime slow sprinters ? The 1996 Olympics produced no such slow-down, but Barcelona 1992 showed a slight slow-down too. Was drug testing more scrupulously applied in Barcelona and Sydney than in Atlanta ? Or did a home Olympics effect spur American sprinters on ?
Altitude and Wind Corrected Sub 10s
Correcting the best 100m times for the effect of wind and altitude (as per JRM's methods), gives results showing a stronger end-of-season improvement effect. But still 23% of sub-10 times occur before end of June. And to find a year as bad as 2003, you still have to go back to 1995. As the graphs below show, the Sydney-Olympic slow down is very evident...
JRM's correction gives the equivalent results that would be expected if the athlete were to have run with zero wind and sea-level altitude conditions.
3D Graphs
The 3D graphs above were produced using Microsoft Excel 2000, and using Paint Shop Pro 5 animator to put a sequence of charts together. The charts were captured from screen (Excel's save to gif feature produces lower quality than screen capture). The animator optimization has to be set formaximum quality, with customization turning off "Write Minimal Frames" and "Map Identical Pixels to Transparent" properties.A conditional formula was used to blank out the data in Table 4 for years beyond a particular date limit, with a macro being used to step the date limit one year at a time. The 3-D figures use a 3D shading trick from John Walkenbach a Removing Lines from Surface Chart which Microsoft do not document.
It quite a few days work to do all this, and I'm not likely to keep it updated beyond the end of 2003 ! And in fact, IAAF data sources kinda dried up or got walled off from free public access, so that updating became impossible.
Other Pages You Might Find Interesting
Comparing 100 m
Sprinting and Trends in Elite Performances |
All Time Best 100 | Trending Annual Averages | Predicting 100 m Limit | Home
Last Revision: Relocated to new host, links checked and updated where possible