Forecasting Cases & Duration of
Severe Acute Respiratory Syndrome (SARS)
Can simple mathematical models give an insight into the question of how many people will be infected by SARS and how well it is being controlled ?
In late 2002, a severe form of pneumonia called Severe Acute Respiratory Syndrome (SARS) broke out in Southern China. It was met by a government determined to deny its existence. Shortly after the Chinese New Year 1st February 2003, SARS spread across the world.
By mid April, over 1200 people in Hong Kong had been infected, including many health workers, and its 6 million people were in a state of virtual panic.
S-shaped Logistic equations have been shown to accurately model the February 2001 outbreak of Foot and Mouth Disease in the UK. What can they tell us about the 2003 SARS outbreak ? With hindsight, the outbreaks in Singapore and Canada were brought under control by early May, but logistic curve-fits made that apparent even from early April.
The results show here that while in the initial stages of an outbreak, the disease seems to spread exponentially, this situation can not be maintained and the outbreak tapers off logistically. While there is a need to respond agressively against the disease, even in April 2003 there was no need to panic - the sky was not falling in.
Overview of SARS
 Officially, SARS was publicly recognised in
Hong Kong around 12th March 2003, and reported in Singapore and Toronto
Canada also in March 2003.
Officially, SARS was publicly recognised in
Hong Kong around 12th March 2003, and reported in Singapore and Toronto
Canada also in March 2003.
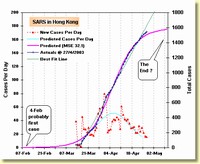
By April 22nd 2003, nearly 1460 cases1 of SARS had occurred in Hong Kong, and few people could see an end in sight. Surpisingly, the logistic equation estimate below suggests that there might be little more than 1600 cases and that it could be over in Hong Kong by the end of May. It was predicting a limit not much below this on 18th April.
Canada
The situation for Canada was a little better at 22nd April, it appeared to be containable below 160 ! By 22nd May Canada had gone 3 weeks without a new case (and the only dark cloud was 5 suspect cases revealed on 24th May). There was something strange, however, in Canada's data in mid April - Canada found the WHO definition was presenting too much bad news and artificially suppressed the reported numbers by introducing its own definitions
Scope of SARS understated was http://www.theglobeandmail.com/servlet/story/RTGAM.20030529.usars0529/BNStory/National (The Globe and Mail, 29/05/03). This is discussed further in Canada Disguises Truth.
Singapore
But for Singapore, even though there is one tenth the case rate of Hong Kong, the situation did not look so simple ... until 7th May, the logistic model was not the best fit to the data, and this suggested there might be no end in sight.
A more complex model for Singapore (Fig 5 below) showed even in Singapore a limit was being approached; and by 9th May, the outbreak was virtually eliminated in Singapore. The above graph stops at 25th May because there were no more new cases - and adding them simply makes the logistic forecast look better statistically but really no more meaningful (there being no point to predicting the limit once it's been reached)!
By April 24th, the graph of cumulative cases in both Singapore and Canada seemed to be settling in on a limit. The end was in sight in these countries..
Unfortunately, by 2nd May the Hong Kong epidemic was not falling away as quickly as should be expected. Although WHO announced that authorities were on top of the epidemic in Hong Kong, Singapore and Canada (earlier in the week), at least in Hong Kong control is not optimal. There also emerged reports that there had been 12 relapsed patients in Hong Kong (eg New York Times 2nd May).
Hong Kong suffered a long tail-off in cases of SARS, much like the long-tailed epidemic curve for foot and mouth disease in United Kingdom. As at 14th May, the epidemic continued a slower-than-logistic decline, and this continued even through to 7th June.
Even in Hong Kong, though, the situation settled and on 24th June, WHO declared Hong Kong to be SARS free after 20 days elapsed with no new cases.
1 Unless otherwise stated, case refers to a probable case of SARS, as per the WHO definition at 13th March 2003. It should not include relapsed cases more than once, but this is not clear from definitions on the HK Ministry of Health site. It also emerged that between mid-April and May 30th, Canada was using a different definition, as discussed later.
Taiwan
At 15th May, SARS was spreading rapidly in Taiwan, and an exponential curve very worryingly gave an excellent fit to the data. By 29th May, fortunately, reality proved to be better than this, and a logistic fit produced a limit of 1308 cases with an impressive r2 = 0.997. Sadly, from 3rd June, Taiwan's reported deviated from expected logistic behavior - with cases being reclassified. Will they go the way of Canada, which played with definitions and went into a full-on denial phase ? As Canada proved, this is a dumb game to play. Taiwan statistics began to deviate noticeably from the logistic curve, and r2 fell to 0.993 by 7th June.
Fortunately, by late June, Taiwan appeared to get on top of the epidemic - and the early bad growth rates fell away. On July 5th, the World Health Organisation removed Taiwan from its list of areas with recent local transmission. Taiwan was the last place for which WHO had travel advisories, and this declaration can be said to mark the end of the SARS epidemic.
Modelling Disease Spread
Straight Line Model

A simple model of disease spread assumes that the rate at which infections occur is constant, and hence the number of infected persons just keeps increasing every day.
For example, that 4.5 new cases will be found every day, with no end. Some variations may occur day-to-day, but on average the number of infected persons will grow by the same number every day.
Looking at Figure 3 above for Singapore up until 16th April, the best fit to the data looked to be a straight line with slope of 4.5 cases per day (see the green line). The bad news in this, was that it suggested there can be no end, should this be correct.
Luckily, this "straight-line" approach doesn't match the observation that, at least in the early days, each infected person tends to infect large numbers of others. One doctor is believed to have infected 120 others in Hong Kong ! Something more complicated must be happening in Singapore (see later).
Exponential Model
A slightly more complex model of growth assumes that each person infects a constant number of other people and continues to pass it on at this rate. For example, for every 7 infected persons, another new one is infected every day (or equally, the infected population grows at a rate of 100 / 7 = 14% per day).
New infections are "born" at a constant rate that is proportional to the total number of infected persons. No infection dies, and if, for example a patient dies, the virus affecting him is passed on so well that another case takes his place to continue the spread. This produces exponential growth, and tends to match observations in the early days of an outbreak.
Exponential growth models, however, like the straight line model, can't allow the disease to ever die out and can't describe how it might be controlled.
Logistic Model
If a disease is managed well, the rate at which infected people are infecting others will decrease, and eventually fall to zero - there will be no new cases occurring on any day. Either the infected people die, or their immune system destroys the virus.
Mathematically, the simplest model that allows such a limit to be reached is the Logistic equation. This model assumes that rate of infections depends on two factors. The number of new cases per day :
- increases in proportion to the number of infected persons (the birth rate of new virus infections), but
- decreases in proportion to the square of the number of infected persons (this is the virus's death rate).
For the mathematicians, the assumption is that the rate at which infections occurs is an unknown function that can be approximated by the first two terms of a Taylor series expansion, see Interpreting Logistic Equation for more details; exponential growth uses only the first term of a Taylor series expansion.
![]()
A more rigorous treatment of mathematics applications to Population modelling once was at Maths 1003 resources at ANU "http://wwwmaths.anu.edu.au/DoM/firstyear/MATH1003/Resources/LectureNotes/03.PopulationModels.pdf". This includes Lotke-Volterra predator-prey relationships which model the interdependencies between predator and prey population size. More sophisiticated models are very hard to solve, and the idea here is to take a simple logistic model (which is easy to solve) to see what use it can be.
Consider an example with an infection birth rate of 20% of the infected population per day, and death rate of 1% of the population-squared: with 10 infected persons on a given day, you would have a potential to have 2 new cases (20% of 10), but one of these is prevented (1% of 10 * 10) by controls. Several days later, there will be 20 infected persons, the potential is to have 4 new infected people (20% of 20) per day, but all 4 are suppressed (1% of 20 * 20 = 4).
Under these assumptions, the population will grow to a particular limit at which the birth rates and death rates match; this limit (or asymptote) turns out to be the birth rate divided by the death rate (see Logistic equations for a more mathematical treatment).
The Logistic equation models growth of populations in which growth of a population of predators is limited by exhaustion of a population of prey - and is sometimes called a predator/prey model. For a good discussion of its history and applications to population growth problems, see"The Refractory Model: The Logistic Curve and the History of Population Ecology", Kingsland, S., The Quarterly Review of Biology 57, 29-52 (1982) In the case of SARS the predator is the SARS virus, the prey are human beings.
Modelling Results
Table 1 - Summary of Modelling with 24th April Data
| Country |
n
|
Logistic Fit
|
Straight Line Fit (y = mx + b) |
||||||||
| Birth Rate (b) | Death Rate (d) | Po | Limit | St'd Error | r2 | m | b | St'd Error | r2 | ||
| Hong Kong | 43 | 0.13 | 0.000087 | 106 | 1535 |
30.7 | 0.996 | 38.7 | 27.5 | 47.7 | 0.990 |
| Canada | 40 | 0.16 | 0.001055 | 5.7 | 148 | 5.3 | 0.989 | 2.7 | 7.6 | 27.5 | 0.618 |
| Singapore | 43 | 0.10 | 0.000449 | 27.8 | 217 | 9.0 | 0.978 | 4.5 | 19.7 | 6.3 | 0.988 |
| Singapore2 | 43 | n/a | n/a | 15 | 189 | 2.9 | 0.998 | ||||
Table 1 summarises the best fit logistic and straight line models for the outbreaks in Hong Kong, Canada and Singapore. Po is the initial population of cases at the 16th March date that WHO statistics commenced. Also shown is the sum of two logistics case for Singapore, discussed below.
The probability that the straight line is the correct fit for Hong Kong is less than 1 in 250. For Canada it is 1 in 2000, but for Singapore 1 in 5.
Outbreak Start Dates
By projecting the logic equation back in time, an estimate of the first case can be found. For Hong Kong, it is 7th February, for Singapore it was 8th February, and Canada 9th March. These outbreak dates for Hong Kong and Singapore were shortly after the Chinese New Year holiday, when many Chinese people returned to their family in mainland China.
Model Accuracy
It can be seen that the Standard Error of Estimate, a measure of the average deviation between an actual data point and the best fit curve, is better for the logistic model in the Hong Kong and Canada examples. For Singapore, the straight line is better, at least until 7th May.
The correlation coefficients (r2) are all excellent , except that Canada straight line is a poor fit(r2 = 1 is a perfect fit). The best correlation coefficients are for the logistic models.
Summing Two or More Logistics
It may be that with the low numbers for Singapore, there are actually two or more logistic curves "stacking up" in such a way that a straight line gives a better fit.
As an example, there may have been a outbreak which had a natural limit of around 100 (see the S shape that tops above 80 cases) with another one added to that. Fig 5 depicts two such logistic outbreaks, which sum to give a very close match to the actual case curve.

The Mean Square Error is 2.69 which means on average points are within 3 cases of predicted curve. This is a much better fit than for the Hong Kong or Canadian simple logistic models.
From an analysis of MSE with F-distribution, there is only a 1 in 5300 chance that the straight line fit is better than the two-logistic sum, and only 1 in 400 chance that the single logistic is better than the two logistic (i.e. that the goodness of fit is just very good luck).
As the epidemic was brought under control, the second logistic equation dominated the behavior.
Stacking 3 or 4 logistics can give better fit statistics (MSE <= 1.7, with impressive low probability of it being wrong compared to the simpler models). But it might be tracking variations in detection and reporting mechanics that will not continue in the future. It is also needs more complex time-consuming methods to optimise due to nonlinearity and local minima problems. To predict the outcome within 3 cases of the right figure would be good enough for most purposes ! Occam's Razor should be applied to the temptation to increase the model complexity...

The summation of 4 logistics shows suggests two outbreaks: P3(t) and P4(t) are the initial outbreak with P3(t) being virtually a "step jump" that probably represents the start of counting rather than disease progress. P1(t) has a similar slope to P4(t), but half its limit - with the slower-to-spread P2(t) element contributing the other half to the limit. This might represent slowing down of the spread of SARS in the second wave.
Use of the summation of two logistics also produces a more recent outbreak date - around 3rd Mar, or a month later than in Fig 3.
An interesting aspect of the two component logistics is that they imply firstly that one person ultimately infected 100 others (in first outbreak), and one person has infected nearly 100 others (in second outbreak). That's something scary, and is supported by the claims in Hong Kong that one patient infected 112 others.
"Several SARS patients have infected more than 30
people, according to the World Health Organization. The biggest reported
superspreader is a 26-year-old airport worker admitted to Prince of
Wales Hospital in Hong Kong in early March. He infected 112 people,
including every doctor and nurse who treated him. Doctors suspect the
cause was a jet nebulizer that sprayed medicated mist deep into his
phlegm-filled lungs four times a day for seven days. The mist expanded
his lungs and was itself exhaled.
- DONALD MCNEIL AND LAWRENCE ALTMAN NEW YORK TIMES, April 18th, 2003
The possibility that the Singapore situation is a sum of several distinct outbreaks, each of which is logistic in nature and will reach a limit, is reassuring for the people of Singapore.
Hong Kong
For Hong Kong, the simple logistic model is better than a straight-line fit. It suggests clearly that there were probably quite a few unrecognized cases around before the Government's first official admissions on 12th March. The first case may have occurred as early as 7th February. The model predicts a limit of about 1689 cases. By 11th May, this limit had been passed, and a more complicated model is needed to explain the 82 cases that occurred after then.
A sum of 4 logistics for Hong Kong produces an interesting fit with a very much better fit (Mean Square Error cut to one sixth or 7.8).
It's worth looking to see if the larger curve above can be decompesd to a series of smaller steps. To test this, look at the sum of 6 logistics. Here is a sample graph ...
The sum of 6 logistics degenerates into a sum of outbreaks of less than 200 cases. It predicts a peak of 1743 cases in Hong Kong (compared to 1689 for the simple single logistic, and 1743 for the sum of 4 logistics). It also suggests some slower-growing spread occurs - as the "rise time" of the S curve widens for some of the components (rise time being, say, the time from 10% of limit to 90% of limit to occur, see Logistic Rise Time for more details).
Unfortunately, the best fit for the 6 logistics has changed as new days are added - and the pattern of components shown in Figure 8 is not stable. Although statistically superior, the lack of stability in the components of the sum of 6 logistics means they probably don't represent an underlying growth process for the epidemic.
The fast-rising curves in the early weeks of the epidemic could be a reflection of the inconsistencies in reporting and lack of reliable definitions that hampered reporting in the early weeks. Once the epidemic spreads beyond a few hundred cases, discerning the contribution of individual outbreaks becomes difficult.
Once again, the extra complexity of summing more logistics, while giving a better statistical fit, might not be tracking repeatable disease processes. Occam's Razor should be applied, and the simpler model chosen if the error of under determination is to be avoided.
Canada
For Canada, the simple logistic is a very excellent fit (r2 = 0.995) at least until 14th May when some cases began to be deducted from the total. The graph from 22nd April certainly had levelled out. But events from 23rd May revealed another outbreak occurred. Although the last new case was previously reported on 9th May (14 days before, well over the 10 day outer limit for incubation period), (formerly published at http://www.newswire.ca/releases/May2003/25/c5436.html) Toronto's Commissioner of Public Health claimed that epidemiologist linked this outbreak to the original outbreak. Canada's second outbreak needed a different logistic equation to track it - see Figure 12 below.
In Taiwan at 16th May, the simple logistic fit degenerated into an exponential (d = 0 ) with r2 = 0.994. While this should be extremely alarming (implying no end), a fit with a sum of two logistics (see Fig 9 and 10 below) produced a better MSE and a limit of 4832, with r2 = 0.995. There was only a 19% probability that the exponential model was more correct.
Unfortunately, on 22nd May, Taiwan recorded the highest daily new cases total - 65 (highest for any Country, with the possible exception made for mainland China's doubtful statistics). And both simple and sum-of-two fits degenerated into exponentials.
But after two days of relatively low new cases (10 per day), the Taiwan curve settled on logistic fits with a limit of 3,800 (for a simple single logistic, mean square error of 10.8). The sum of two logistics fit improved this to a limit of 1227 with mean square error of 8.28.
The situation continued to improve and by 29th May, falling case rates brought the limit below 800. A 3-logistic sum gave a better fit than 2, with the MSE falling to 7.6. Unfortunately, from 3rd June, Taiwan's data took on strong signs of unreliability - as if they'd gone into denial mode, and the MSE rose...
The data to date shows evidence of the point of inflection on the S-curve. Around 22nd May, Taipei Times reports indicate that the government there had repeated the mainland errors of denial, cover-ups and belated actions leading to resignations of culpable leaders. The erratic movement in daily cases up til the 29th May does not suggest the process is very well controlled.
As can be noted from figures 13 to 15 to below, in the early stages of an epidemic outbreak, exponential behavior is sometimes the best fit. This is just an indication that things are out of control. And unsurprisingly, in Taiwan around 21st May, hospital staff were deserting their posts because of their concerns that basic protective equipment and disinfecting supplies were not available.
From 5th to 24th June, Taiwan began reclassifying cases, suggesting an unreliability in their reporting either before or after this time ! Superficially, the outbreak appeared to have spent itself. But the Canadian experience should warn readers against jumping to this conclusion too soon - particularly when the obvious parallels with "reclassifying" data are accounted for.
Shortfalls ?
The Hong Kong Department of Health published the following epidemic curve on 17th April, describing it as showing the date of onset of each of 1152 patients.
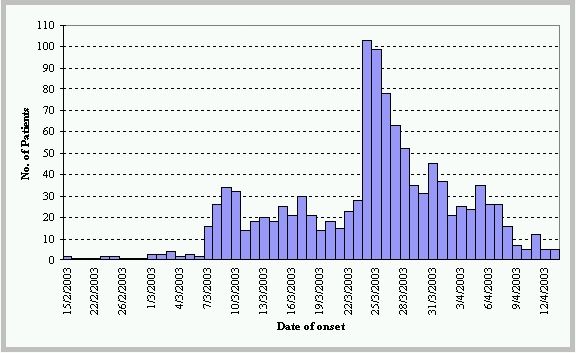
The graph extends only to 13/4/2003. It looks markedly different to the Daily Cases curve in Fig 1 above. On the 12th and 13th, Hong Kong reported 42 and 41 new cases of SARS, and a total of 1150 on 13th. Yet this graph shows less than 5 on each of those days. Although it paints a nice picture of a good logistic-like tail-off, it doesn't look very reliable.
It might be the kind of graph you would publish to pretend you were doing a good job of controlling the epidemic; but it isn't accurate.
Canada's Disguises Truth ?
From around the 12th April, Health Canada's definition called SARS probable if a patient meets all the criteria of a suspected case and has a severe "progressive" respiratory illness. The WHO asks only that criteria of a suspected case be met and that evidence of the illness can be seen in chest X-rays or that a patient tests positive for the SARS coronavirus, something that does not occur in all cases.
Because not all SARS cases can be seen to be progressing, many people who would fit the WHO's definition do not meet the test in Canada. In fact, medical experts in Ontario said (29/05/03) that perhaps half of all of the province's 23 active suspected cases would be classified as probable if the UN agency's criteria were used.
Since most people with SARS eventually show a progression of the disease, they end up transferred to the list of probable cases - so Canada's tactics produce no more than a temporary lull in the storm - as can be clearly seen in Figure 2 at 12th April - with a dramatic catch up following around the 15th April.
The reclassification of cases after 10th May, and dramatic rise in cases at 24th May are equally doubtful statistics. This site has avoided plotting mainland China statistics due to concerns about fudging of the data - and by 29th May it's was clear that Canada's data is highly suspect.
The incubation period for SARS is believed to be less than 10 days. The world is supposed to believe Canada had gone 20 days (double the incubation period) without a case. And then suddenly 5 then 3 more, then 25 more appear. Either a fresh outbreak was imported from overseas, or Canada was lying and covering up the occurrence of some of these cases. By admission of the Ontario Health Commission, the new cases were linked to the original outbreak, hence the deception and cover-up line is more credible.
Belatedly, on 30th May the Canadian's realised the game was up, and switched back to reporting by the WHO definition (http://www.theglobeandmail.com/servlet/story/RTGAM.20030529.usars0530/BNStory/National/) The Globe and Mail, 29/05/03). The number of probable cases jumped by 25 (from 8 to 33) in one day.
The Canadian's lack of transparency makes it dangerous to read too much meaning into the data.
A fit of a sum of four logistic curve gives a very good match to the data (r2 = 0.996, at 13th June). Notice that P2(t) and P3(t) are virtually step jumps (rise time less than 1.5 days) resulting from Canada's fudging its statistics. The disease can't really spread that fast.
The occurrence of the second outbreak also shows the futility and plain stupidity of hiding the truth about SARS. As much as the tourism industry might like to pretend there's no problem, the relaxation and denial its short-sighted view promotes is very plainly counter-productive.
Bias in Logistic Fit
Even Fig 1 shows some signs of bias or unreliable data. The last few days are all above the logistic prediction. This is not what should be expected from random sampling or reporting errors.
Considering the sensitivity of the prediction to new data can shed some light on this. What would the estimate be if take away points near the last few ? Fig 13 below answers this comprehensively. It plots the expected maximum number of cases that was calculated each day up until the 16th April on the basis of data available at that date (e.g. the result for 10th April is the best fit approximation on data only up til the 10th April).
Fig 13 shows that the maximum cases prediction has been growing steadily since 6th April. Around 1st April, the model becomes almost purely exponential growth. Earlier in March, the logistic fit predicts more steadily in the range of 300 to 400 cases. The eratic results, particuarlyin March and early April could be due to the difficulty of diagnosing SARS conclusively, and/or the effects of under-reporting.
For Canada, the logistic model fits much more closely, and until 14th April was less sensitive to recent data, as shown in Fig 15.
Nevertheless, the best way to interpret these statistics are that although the logistic model gives the best fit to the data, the disease and methods to combat it are still evolving. There is strong evidence of under-reporting due to the difficulty of identifying the disease, compounded by government's unwillingness to scare off business and travellers.
While it is tempting to compare the statistics, particularly between Canada and Singapore where the initial outbreak was contained, differences in the diagnostic and reporting standards need to be recognised.
SARS Containment
On Monday 28th April, the The World Health Organization lifted its advisory against travel to Vietnam (which had been free of cases for 20 days) and said that SARS infections appeared to be dwindling in Singapore, Canada and here, but warned that the disease was still spreading in China. The logistic equations forecast this dwindlng more than 10 days before WHO's relaxation.
On Friday 23rd May, travel advisory's against Hong Kong were lifted, although Hong Kong did not get any zero case days until Saturday 24th May (and certainly had not 20 such days!). Similar travel advisory's had not been lifted on Singapore - because it had not met the condition of 20 days with no new cases. Has WHO used a double-standard in lifting Hong Kong advisories ?
It was not until 30th May that WHO removed Singapore from the list of areas with recent local transmission of SARS.
On 24th May, reports emerged that Canada was investigating a possible 5 new SARS cases. By 26th May, these had become 8 new probable cases and a link was reported to the original outbreak (see update 65, issued 26th May, which reports a total of 148 probable cases for Canada - only). Canada has been eager to downplay the threat by using its own definition of active cases - and hasn't explained the reclassification of probable cases from 13th May. Is this symptomatic of a form of denial that has let SARS loose again, just when they should have been nailing the lid down firmly ?
Hong Kong's slow tail meant that WHO did not remove it from the list of countries with recent local transmission until 23rd June (the last case was 2nd June, approximately 20 days earlier).
On 24th June, Beijing was removed from the list, then Toronto on 2nd July and lastly Taiwan was removed on 5th July. However, there is considerably uncertainty about the extent to which SARS has spread to poorer provinces in mainland China. SARS can be contained - as the logistic fits show. But containment requires considerable vigilance and effort on the parts of governments and no small measure of international cooperation.
Source of SARS
Hong Kong researchers announced (on 23rd May) that they had isolated the sars virus in masked palm civets - a type of wild cat related to the mongoose and considered a delicacy in Guangdong. This was found after testing 25 animals representing 8 species in a live animal market that supplies restaurants in Guangdong (China) - where SARS is said to have started. Reports also suggested that the first cases of SARS arose amongst workers from the live animal market (see NY Times, 23rd May)
- eat anything with legs except the table, and anything with wings except the airplane
- If the back faces the sun, it's okay to eat it.
WHO's chronology of SARS attributed the first case of SARS to 16th November 2002 in Foshun City, Guangdong Province, China.
Conclusion
The logistic equation fit produces an excellent fit to the epidemic curve (statistically speaking). Some caution is sensible in applying it, as the predictions vary as new daily data is brought into consideration (particularly in the early stages of the outbreak). Near the end of the outbreak, the logistic predictions become more stable, and could be interpreted as reflecting the success of the eradication strategies.
For Singapore and Hong Kong, using sums of logistic curves produces statistically superior fits, but the best fits obtained (with 4 or 6 curves summed) seem to be modelling non-recurring processes - perhaps reporting errors - and this may devalue their use in predicting the future. Having said that, at least around 7th to 11th May, they remained stable and very good predictors of the daily case rates.
The limits predicted by the simple logistic fit were reasonably close bounds for the total number of cases.
The logistic predictions showed that, as of 22nd April, the outbreak in Singapore seemed to be (and was) under control. The predictions from around 18th April were being matched quite closely. In Hong Kong, the situation by 2nd May was not waning as quickly as it was expected to. Yet by 24th June, it appeared to have reached a limit.
At the 12th May, the outbreak in Singapore looked very much under control and was.
Fortunately, Singapore maintained its vigilance throughout early May. Singapore diagnosed its last case on 9th May and more than 10 days have passed with none. As 10 days is believed to be the outer limit of the incubation time for SARS, any further cases are likely to be an unrelated outbreak. On 31st May, it was removed from WHO's travel advisories list.
Canada appeared also under control with cumulative cases in fact falling from 149 on May 2nd to 139 on May 16th. On 14th May, Toronto (where most cases occurred) was removed from the WHO travel warnings list. But by 25th May, a new surge in cases was reported - showing the perils of declaring the "show-over" too soon.
Even though WHO lifted travel advisorys on Hong Kong (on 23rd May, before a zero-case day had occurred), Hong Kong was still not clearing SARS as quickly as should be expected, and it needs to ask some hard questions as to why this it let the outbreak drag on until June 23rd. Other countries, including both Mainland China and Taiwan, were showing no signs of having SARS under control until the beginning of June.
On 6th June, WHO reported that SARS had passed its peak in every country, except perhaps Mainland China. Could it be that the on-going trickle of cases in Hong Kong are coming from new infections being imported from the mainland ?
At 13th June, WHO lifted travel advisory's on several Chinese provinces, leaving only the capital Beijing and Taiwan under advisory's. Hong Kong and Toronto were still producing new probable cases on a daily basis, and airport screening of passengers leaving these cities was still required.
By 23th June, WHO declared Hong Kong to be sars-free. Beijing followed on 24th June. Toronto was not cleared til 2nd July - and lastly Taiwan's travel advisory was lifted on 5th July. It's tempting to think this is th end of the epidemics - but the situation in mainland China is still unclear and all governments need to be vigilant to prevent SARS exploding again.
Disclaimer
The site author is not a nurse, doctor, virologist, epidemiologist, nor crystal-ball gazer. That doesn't make these predictions wrong, but you should consult such experts before relying on the any of the above.

First Case of SARS ?
Presently it's a mystery as to where and when SARS first occurred - perhaps only known with certainty within the inner sanctums of the Chinese government.
Unofficially, reports of a mysterious pneumonia-like illness in Southern China were getting around from late October 2002. A report on Sydney's Channel 7 on 24th April, by Medical Reporter Dr John D'Arcy, included an interview with a Sydney businessman who thinks he picked up SARS in Guandong province in September 2002...
Graeme Leigh spent months in Guangdong, China, where the SARS virus emerged. In September of that year he became desperately ill with respiratory infection, high fever, headaches and was coughing up blood.
Despite his illness, he did not seek medical help. "I couldn't breathe, I couldn't do anything," he said. Mr Leigh returned home and despite antibiotic treatment it took months to recover.
There's no proof Mr Leigh contracted the SARS virus but he's not so sure of that.
Mr Leigh's case demonstrates that some people can be very sick without seeking medical help - at least in China. In the actual (live) interview, Mr Leigh indicated he did not seek medical help in China because he had no confidence at all in their medical system. His case won't show in any statistics China might keep. He did, however, seek help on return to Australia - but SARS was unknown and he might have been lucky enough not to infect anyone else.
Another excellent account of the initial stages of SARS can be found in Chris Taylor's May 9th article from the Japan Times The Silent Birth of a Killer Virus .
If you have a similar story, and would like to share it with this site's visitors, email me (details below).
WHO was to eventually attribute the first case of SARS to Foshun City, Guandong, China, on 16th November 2002. But maybe it was about somewhat earlier !
Transporting SARS
What is the risk of SARS spreading to another country ? As an example, consider Australia.
Let's assume that SARS is randomly distributed in the populations of Hong Kong, China and Singapore at about the same rate as it has occurred in Hong Kong. As at April 26th, that rate was 1 person in 4000 approximately.
Using Australian Bureau of Statistics data for short-term inbound and outbound travellers, on average about 1320 short-term visitors arrive each day from Hong Kong, Singapore or China. Approximately 1150 Australian's return from short-term visits to those same places (and the average visit is over 2 weeks in those places). So an average day would see 2470 arrivals from people who've spent two weeks or more exposed to the virus environment.
The virus has been at large at least since 1st March, 2003. So there's been 56 days of these 2470 arrivals. Take 56 x 2470 / 4000 = 35 cases. Yet Australia had reported only 4 cases at this point - barely one tenth.
Is Australia
- Lucky ?
- Hiding the real stats ?
- Not diagnosing cases ?
A strong possibility is that SARS is not evenly distributed throughout the population of Hong Kong, or any of the affected countries. Rather, it occurs in clusters. Australia has probably been lucky that none of its travellers have been close enough to these clusters.
On 20th May, the Australian Bureau of Statistics reported that the number of visitors from southeast Asia in April was 40 per cent lower than a year before, and arrivals from northeast Asia were down by 28 per cent. The Sydney airport figures showed markets hit hard by the downturn included Taiwan (down 53 per cent), Hong Kong (down 35 per cent), Japan (down 33 per cent), China (down 30 per cent) and the US (down 12 per cent).
The fall in arrivals, and an 11% overall fall in departures, can explain no more than half of Australia's good luck - but the other half is still unexplained.
Perhaps part of Australia's good luck was due to it being in the Southern hemisphere summer when SARS broke out. SARS appeared to take hold only in the Northern hemisphere - and died out as each country reached summer.
Data Sources
World Health Organisation provides links to reports produced Monday through to Saturday which tabulate the Cumulative Number of Reported Probable Cases of Severe Acute Respiratory Syndrome (SARS). These data were used initially as the source for the above graphs.
Checks against local health authorities published data in Hong Kong, Singapore and Canada showed some error in the WHO reports, and allowed the Sunday gaps to be filled.
- Health Canada Canada - Summary of Severe Acute Respiratory Syndrome (SARS) Cases Canada and International
Hong Kong Hospital Authority - Sars Outbreak daily press reports detailed the progress of patient tracking and cumulative cases statistics. See also Hong Kong Department of Health site, which includes links to the report on the Amoy Gardens outbreak. If you haven't been in the habit of regularly disinfecting your drains, you should get into it smartly !
Singapore Ministry of Health SARS - Latest Updates (news) listed daily press releases giving details of patient tracking and cumulative case statistics (was "http://app.moh.gov.sg/sar/sar03.asp"). The Singapore government is hardly the darling of Western liberal politicians and academics, but it has been excellent in publication of timely statistics and information on SARS. Around 1st May, an epidemic curve was published but was not updated every day (was http://www.gov.sg/moh/newmoh/ppt/sar/epicurve.ppt) .
Beijing Hoodwinks WHO Inspectors Times Asia's 18th April allegations that hospitals in Beijing were deliberately misleading World Heath Organisation inspections of SARS patients. Suggests there may be 10 times the officially published number of cases.
Taiwan's daily statistics was found at http://www.cdc.gov.tw/sars/en/Daily%20Update/SARS%20Cases%20in%20Taiwan.htmTaiwan
Centre for Disease Control, Daily Update
Feedback
Got a question or like to leave some feedback ? Click here to Email K Duffy.
Viewing tested in IE5 and IE6 only. Printing is best in IE6 or later (IE5 and other browsers may split image printing across pages). Javascript must be enabled for spam protected email links to work.
Last Revision: host relocated, links updated
Back to Kevin Duffy's Home Page