ruler line
star animation title star animation
ruler line

Using QuasiG is meant to be simple. It has default input values that will produce a simple image of penrose tiling. Experiment with the various options to see what they do (example images on the QuasiG page include a summary of the options in the title bar, so you might like to try creating them to prove your installation worked).

If you're not familiar with Weeks's quasi.c, just download QuasiG and play around a bit !!

QuasiG options are accessed through its Tiling Options Dialog pop-up. This dialog appears when you run the program, and whenever you access the File/New menu item.

Depending on options selected, you may be presented with a series of color dialog popups. These are for selection of Penrose Dot color, Penrose Line Color, and color code for each unique tile area.

The program then calculates the pattern, and displays it in a scrollable window that's 32 cm by 32 cm. If Penrose Tile marking is selected, with large number of generating lines, or a slow computer, expect significant delay.

You can open up new tiling windows by File/New - and your previous options become the default selection for the new window. This makes it easy to make just small changes from one plot to the next.

ruler line

QuasiG Tiling Dialog Options

  • Degrees of Symmetry - Choose an odd number. For example, 5 for penrose tiling. Rhomb angles will divisible by p / 5. Higher numbers can be interesting.

  • Generating Lines - choosing more of these makes the pattern larger. You can choose really small numbers like 5, 7, 9 ... to see how the construction process works. QuasiG has options to scale the tiles down to ensure they fit on the scrolled view.

  • Offset Multiplier - a factor that changes the offset of the generating line sets, and thereby changes the pattern quite significantly. For example, try 0.1, 1, 10, etc.,.

  • Center of Pattern - tick to include only central tiles in the pattern. Tiles which do not adjoin at least two others are omitted. For 5-fold symmetry, you get a central decagon shaped pattern.

  • Fill On - tick to have tiles filled with user-selected color. You will be prompted for a choice of color for each differently sized tile (one for fat, one for thin).

  • Double Colors - tick to have tiles filled with two colors used for each sized tile. This is Weeks' filling option, and gives two colors for each tile shape that seem to get allocated alternately as you radiate out from pattern features.

    For this option, when you choose colors, you a really just defining Hue and Saturation - lightness is determined in the algorithm as one of two shades for each size of tile.

  • Gradient Fill - tiles are filled in a variant of the Double Color method. Lightness is varied amongst the same sized tiles (in a cycle length equal to the degrees of symmetry). This tends to hide the symmetries in the pattern - but I liked the look of the results it gave; and so did curious onlookers passing by my desk. For this option, when choosing colors, you are also just defining Hue and Saturation.

  • Rotate x==y - just exchange x and y directions. Most decent bitmap editors (e.g. PaintShop Pro, Corel Draw) will do this sort of thing and more !

  • Tile Edge Black - ticked means edges of tiles drawn in black. If cleared, tile edges drawn in same color as tile (so they effectively disappear).

  • new1 gifPenrose Match Marks - each tile is inscribed as per Fig 1 above. If marks don't line up in a pattern, it's not a penrose tiling.

  • new1 gifArcs Not Lines - tick to get arcs inscribed in fat tiles as per Fig 1 above. Otherwise, get lines across the fat tiles. Defaults to arcs

  • Auto Zoom Out - if set, QuasiG determines the overall size of the pattern, then scales it back to fit within MS Windows' limits (roughly +/- 16 cm of origin). If clear, no scaling is done - you get to see just the 32 x 32 cm subset of the pattern that's centered on the origin. QuasiG's rhombs have 1 cm length sides.

  • Magnification - allows you to specify a magnification factor. If less than 1, the pattern is shrunk (zoomed out). If larger than one, pattern is enlarged (zoomed in).

  • Quadrants to Plot - push-button selections determine which quadrants of the cartesian plane are plotted.

  • Start Tile - default is 0 - meaning omit no tiles from display. 10 means do not plot first 10% of tiles etc.,. Useful if you want to isolate a subset of tiles.

  • End Tile - default is 100, meaning tile plot ends at last tile generated. 90 means do not plot last 10%, 80 selects out the last 20% etc.,.

  • Writing Delay - non-zero value will cause CPU to spin it's wheels in between drawing successive tiles - thereby slowing down the drawing process (so you can see what's happening !)

  • Penrose Dot Color Dialog - choose, or mix a custom color for use in the fat tile narrow vertex (dark color in Fig 1). The lighter dot used in the thin tiles gets the same color as the lines (arcs)

  • Penrose Line Color Dialog - choose, or mix, a custom color for use in the lines (arcs) across the width of the fat tiles.

ruler line

QuasiG Features

  • QuasiG can show variants of quasi-crystal tiling that are different to the one chosen by Eric's algorithm, such as ones with stars made of a cluster of ten thin tiles ( I first made one like this with Eugenio Durand's QuasiTiler web site, then experimented with Eric's code to get it to make something similar)

    You might find it necessary to increase the number of lines used in the generator if you increase the offset multiplier factor much above 20.

    Eric's quasi.c defaults are equivalent to OffsetMult = 1. Choosing patterns other than Erics' standard results in no obvious focus, and other interesting higher-level patterns (see examples ).

  • new1 gif QuasiG has a number of co-ordinate reporting and tile identification features for help in understanding the tile drawing sequence (try mouse right click on a completed drawing, maybe using a small number of generating lines eg 5, then watch what happens when you increase the number of lines).

  • QuasiG can reveal some interesting patterns not shown in quasi.c:

    • it can plot all four quadrants of the cartesian plane, and not just the small segment revealed by Weeks's quasi.c.

    • this larger plot shows limits in the tiling pattern, and some assymetries in the pattern.

    • For example, with 5-symmetry, you can get a central decagonally shaped tiled region (more evident for larger line sets), with color coding that reveals "lines" running through the pattern that divide it into segments of a pentagonal star (choose, say, offset multiplier 10) ; these remind me of the worms Conway describes in Penrose patterns, but may be something different.

    • non-continguous tiles can be seen to be distributed out to the points of a decagonal stars (two five point stars) that can be superimposed over the central pattern.

    • Many of the lines running through the default pattern converge on a point in the 3rd quadrant that looks quite different to most of the pattern and which draws your focus.

      I'm no maths prof, so I don't know what these mean ! But my guess is they're evidence of periodicities that mean the pattern does not satisfy the Penrose matching tests.

      Please e-mail kd@condellpark.com.au if you can shed some light on this !!!

  • QuasiG also has
    • an auto-zoom scaling option that allows the full extents of the plot to be viewed, or you can use hand-entered magnification factors.

    • new1 gifA Start Tile (as % of Tiles) and End Tile option allows selection of drawing of a range of tiles, which can be used to build animations of the drawing process (see animation example )

    • The mid-point connecting options available in quasi.c have not been implemented - my main interest was in looking at the more straightforward patterns.

    • You can have up to 500 generating lines - but beware that you would need > 110 Mbyte of virtual memory to run a 500 line example, and could run out of memory (e.g. if your disk with the swapfile hasn't enough free space).

    • QuasiG also uses a different drawing order to Weeks's Unix program. Weeks's program plotted tiles from the center of the pattern outwards - this is probably best if plotting on an x-y plotter, but not needed for Screen display and page-display printers. So QuasiG justs plots the tiles in the order they are generated. I found it interesting to watch the tile generation (minimize/maximize the window for action-replays!), and included a delay option to slow down the drawing process. This can be helpful if trying to understand the algorithm.

    • QuasiG displays it's output in a scrolling window that extends +/- 16 cm either side of the origin, and has an auto-zoom scale (Magnification) feature that will set the magnification at a figure that allows the whole pattern to be viewed. You can use the File/New option to open additional windows - Tiling Options will default to your last choice.

ruler line

Tile Marking new1 gif

Tile Marking was a new feature in QuasiG V1.3. It's useful for investigating the sequence in which tiles are drawn. Read further only if you're curious about how it works...

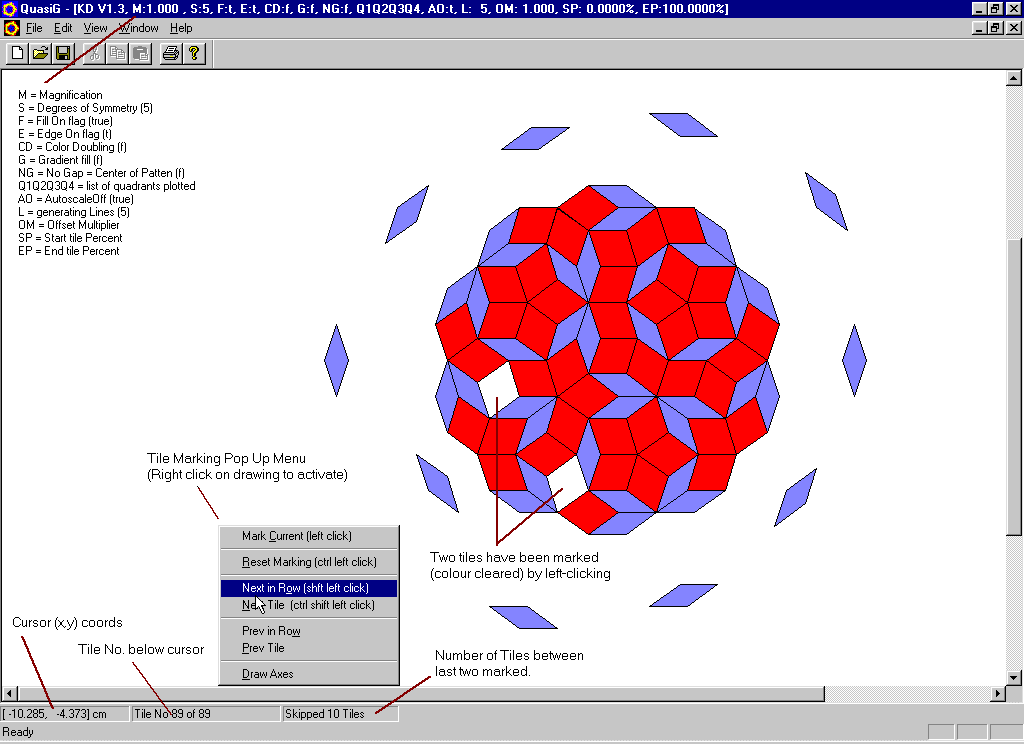
Quasi G - Tile Marking sample screen

The Status bar identifies the Tile No of the tile under the cursor. The Tile No is its index (or order) in the generating sequence; if the cursor is not over any tile, the Tile No will be one more than the maximum number of tiles.

Tiles can be marked by clearing their colour, as an aid to identifying the drawing progression. Mark an individual tile by left clicking on it - it's colour will be cleared. If you mark a second tile, the Skipped Tiles box of the status bar reports how many tiles were drawn between the last and previous tiles. This is not how many lie between them on the tiled plane - rather it is how further along in the generating sequence the tile occurs.

The Status bar now includes reporting of the (x,y) coordinates of the cursor. Coordinate axis can be superimposed on the image, by using the Tile Marking Pop-up Menu item Draw Axes. To activate the Tile Marking pop-up, right click the mouse anywhere on drawing.

The tile drawn immediately after a marked tile can be identified by Tile Marking menu Next Tile function. This can be repeated to show successive tiles, but only the last S tiles remain marked (where S is the Degrees of Symmetry). Prev Tile marks the previous tile in the sequence

The Tile Marking menu Next Row function identifies the tile drawn in the next row (there are 2 * S tiles per row). Prev Row goes tothe previous row.

ruler line

QuasiG Techo Details

You don't need to understand a word of the next two sections in order to use QuasiG. These words are for the techo types out there...

QuasiG is written in Visual C++ V6.0, as a 32 bit MDI application using MFC classes. It was my first attempt at writing such an application, and does some unusual things - like popping up its configuration dialogs before you've seen a main window frame, and maximising the document window (you can use the Window/Cascade or Tile options to change the latter after the windows open).

QuasiG Memory Stress

QuasiG generates the tiles to memory (rather than directly to display). It uses the MFC CArray class which dynamically allocates space for tiles; the memory is released when the display window is closed - and varies in proportion to s/2*(s-1)*l^2 where s=symmetries, and l=lines. It can be interesting to plot the Windows 95 System Monitor's memory manager items while running QuasiG. It also gives your graphics adaptor a pretty serious workout (when running in colour fill mode), and can stree remote login software like RAdmin, TNG Unicenter and PC Anywhere.

If you understood this techno-talk, you might be interested in a copy of the SourceFilter programming utility.

ruler line

Printing this Page

Printing with many browsers (including IE5.5 and earlier) often doesn't work real well because most browser print functions don't handle the horizontal scrolling view you get on screen. This page has been put together to facilitate printing the text on an A4 page - essentially you will see everything within the white area of the background.

However, many of the images extending outside this area will get clipped out. You could try changing your print setup options to select landscape printing layout (but they'll mostly be split across a page).

If you really want to print the images, make them with QuasiG and print directly from its File/Print menu item. This will print the screen image across 4 A4 size pages (A4 tiles !) - the screen plot area is 32 cm by 32 cm, and prints isometrically (1 cm of screen = 1 cm of page).

ruler line


QuasiG Home | Examples | Animation | Storey Hall

Back to Kevin Duffy's Home Page | Download Quasig | SourceFilter

ruler line
Page Created 19th June 2001, Last Revised 24th Jan 2017
Last Revision: Relocated to new host, some broken links updated
ruler line

This material may be used for educational non-profit purposes with proper acknowledgement of the source. If any images created with QuasiG are posted on the net, send me the link url. All other uses, please email kd@condellpark.com.au