|
Updated Airport Growth for Sydney Airports KSA Under-Utilization and Peak Charges
SATS technological challenges? |
 |
| DOT | Draft | Final EIS | Logistic | Logistic | ||
| Year | Actual | 7% | EIS | Jul-99 | 1997 | 2000 |
| 1998 | 21.6 | 23.1 ( 7.2%) | 22.7 ( 5.4%) | 21.6 (0.1%) | ||
| 1999 | 21.9 | 24.7 (13.0%) | 24.1 (10.2%) | 22.5 ( 2.7%) | ||
| 2000 | 23.3 | 26.5 (13.8%) | 25.2 ( 8.4%) | 24.0 ( 3.2%) | 23.4 (.5%) | |
| 2001 | 26.4 | 28.3 ( 7.1%) | 26.4 (-0.2%) | 25.0 (-5.4%) | 24.3 (-8.2%) | 23.8 (-9.9%) |
| 2002 | 23.9 | 30.3 (26.8%) | 27.6 (15.5%) | 26.1 ( 9.1%) | 25.1 ( 5.2%) | 24.8 ( 3.8%) |
Logistic Equation ProvenThe logistic equation forecast from 1997 made by this site (see Logistic Equation prediction of airport growth) showed better fit with the actual data from 1997 to 2000 (see Table 1 above, and graphs) than either of the alternative DOT 1996 or Draft EIS 1997 forecasts. Updating the Exponential ModelsWhat do the regression based exponential methods tell us if updated to account for the 1997 to 2002 data ? These forecasts have been updated in two steps - after FY 2000 and FY 2002 data became available: |
|
Firstly, the exponential model in 2000 predicts almost the same growth (5.84% instead of 5.87%), but with a down-shifted curve (starting at 3.22 million passenger movements per year instead of 3.26 in the year 1966, compared with 2.70 mpy actual in 1966). Over the period to 2025, this lowers the prediction from 110 mpy to 100 mpy. The few extra years data don't make much difference. Adding the two years 2001/2002 make barely 1% difference, lowering the 2025 prediction down to 99 mpy. Logistic Model UpdatedUpdating the logistic model shows less drastic change. Using data to 2000 raises the 1997 logistic predicted 2025 demand by 5.4% from 37 mpy to 39 mpy , and 42 mpy using data to 2002. This is a worrisome increase. It would seem that the extra few years of good growth is overcoming the two bad years in 90/91. But interpreting the changes to 2002 is risky - as it's difficult to determine how much of the 2001 spike was due to the Olympics effect and how much of the 2002 fall is due to the Sept 11 2001 decline in air travel. The 1990/91 dips corresponded to a widespread recession in Western economies, and some of the decline in 2002 may be due to the onset of a similar recession (which of course are never admitted by politicians of the day). Nevertheless, it seems that KSA will have reached it's peak capacity by 2020. There was a lull in demand in 1999 preceding the Olympics, made up for by strong growth in 2000. Financial Year 2001 should also be expected to show strong growth (as this is when the Olympic occured). While tourism chiefs are hoping for this growth to be sustained, the Olympics brought fewer people than expectations, and it would not be surprising to see 2002 demand to fall back to the underlying levels. The Olympics produced a peak international passenger movement that was only 8% higher than a two-years earlier figure (so average peak growth is around 4%). Together with the fact that 42% of the Olympic peak day were arrivals, this suggest that growth isn't that spectacular. The DOT's latest (Final EIS) forecast shows it was clearly expecting some attenuation of the growth rate. This is tantamount to saying the future will be different to the past. It really then becomes a matter of guesswork as to what the "death rate" may turn out to be. By fitting a logistic equation to the historical data, plus the DOT Final EIS future, you can produce an estimate of the death rate they have implicitly guessed. A logistic curve with b = 0.0673, d = 0.000948, and P0 = 3.44 gives the best fit, and the upper limit for long term travel demand is 71.4 mpy. This logistic curve fit to the Final EIS predictions has a mean square error of 0.94 on the historical data, compared to the best (least square error) logistic fit to the actual data which has mse of 0.86 and gives b = 0.0582, d = 2.32 x 10⁻⁶, and P0 = 3.44 The Final EIS guess could be an underestimate. Any second airport may need to be much larger than presently thought, and KSA may need substantial expansion. KSA Under-Utilization ?The Second Airport Final EIS, Appendix J, has forecast (see column T) that KSA will have a capacity of 40 million passengers per year. Is this reasonable ? Doubling KSA would undoubtedly disturb the vast hordes living under its approaches. But it seems feasible. Take the peak international passenger movements (from October 2nd, 2000) of 45,000, and multiply it by 365 days per year, you get a theoretical capacity of 16.4 million international passenger movements; as of July 2000, all we'd achieved was 8.04 million. So KSA is running at about 49% of its theoretical capacity - suggesting there is room for doubling - without aircraft getting any bigger than they are today. This raises two interesting point: can peak lopping manage airport capacity better, and what if aircraft get smaller than they are today ? Expanding Airports v's Peak-LoppingThe EIS forecasting has been based on coping with an ever-expanding total passenger movements per year. But what is really critical is the peak capacity. The question needs to be faced: can we afford to be building airports to suit the worst few days of peak holiday periods ? Can the users afford to pay for something that's only going to be used a few days a year ? A similar question has arisen in the electricity industry - generators (particularly the privatised ones) are claiming it's not economic to build power stations to cope with a few peak days in winter and summer. The suggestion is that load-shedding (brown-outs and if necessary black-outs) should be accepted by the public instead. The public includes some people who need electricity to maintain their health (e.g. kidney dialysis machines), or others who'd freak out if caught in lifts in city buildings. If you can suggest peak-lopping for something as critical as electricity, why not for air travel ? Travelling by air is a luxury - and not one of life's essentials. Airlines already get "fully booked" at peak periods, and don't try to provide enough planes for whoever might want to travel on a few particular days. So why not plan to allow airport capacity to restrict travelling capacity at peak times ? It might even be smart to do it, especially if supported with surcharges on landing rights at peak times. This would provide funding for capacity expansion, and ensure that monopoly rents are not inefficiently captured by lazy airlines. The regulation of the airport operators return on assets will ensure the funds find their ways into capital works, whereas there's no such restraint on the airlines. Air ticket prices are already substantially higher at peak holiday period times (as indeed is accomodation and everything else related to the travel industry). Why the hell aren't airport landing charges structured to reflect this too ? This is a serious deficiency in the airport pricing proposals put to the ACCC in 1999 and 2000, which nobody seems to have cottoned onto. |
|
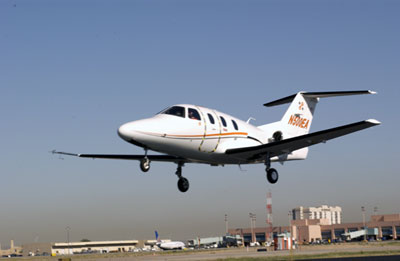
The Eclipse is the first of a new-era of mass-produced low cost GA jets, projected to have direct operation cost of just $A0.77 per km (or $US0.56 per mile) and cruise at 658 km/hr (355 knots). For comparison, the Dash-8, a propeller driven aircraft popular on Australian regional routes, travels at only 280 miles per hour. The Eclipse is likely to spawn an entirely new air-taxi industry and steal the lion's share of the lucrative first class and business class travellers market from traditional airlines. No wonder most of the major airlines are looking to establish cheap no-frills subsidiaries (see Qantas new subsidiary Australian Airlines)- they can see the competitve threat to the top end of the market, and have to develop alternatives for their survival. How long before the airport planners feel this wind change ?
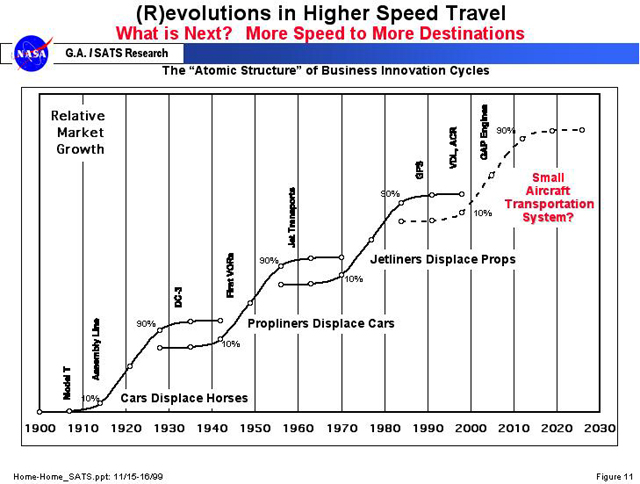
NASA's SATS program argues that the move to a new class of mass-produced GA jet will result in higher speed travel by cutting down on the travel times and delays incurred in using traditional hub-and-spoke airport systems. In August 2002, a Sydney-Brisbane business trip (around 734 km or 458 miles), the average speed was 220 km/hr or 140 mph door-to-door (Bankstown, Sydney to Toowong, Brisbane). The trip took well-developed motorways to/from the airports, and a 767 from KSA (cruising speed 830 km/h or 516 mph). On the return trip later that day, the flight was delayed one hour, giving 173 km/hr (110 mph) average speed. Sure, the 767's and 737's can cruise fast, but the time taken to travel to/from the airport, taxiing, boarding and waiting time at the airport, neutralize their speed advantage. The scheduled air journey time of 85 minutes was only 42% of the overall journey time, and the 30 minute pre-flight check-in wait time was another 20%. NASA presents logistic curves showing the development of high speed travel through the last century, including details of the three generations of piston GA aircraft. NASA's research supports the argument that logistic curves provide a more appropriate model for forecasting future air travel needs.
SATS technology leads to the distinct possibility that more GA airports could be developed around the city to reduce travel times and service this new market (American cities already have lots of GA airports). Traditional airlines may be left only with less time-constrained economy class passengers who are prepared to travel out of peak hours and tolerate large airport delays. Sydney's KSA is ideally situated to play a major role in supporting an air-taxi market - provided the long-haul cattle-class airlines can be persuaded to move out. Bankstown Airport, formerly a GA airport, is likely to have a more limited role in supporting air taxis because of the one hour travel times to the CBD in peak hours and its distance from the homes of the travelling elite. Australia's politicians, who like to fly business class, may be among the early adopters of this new SATS technology. Their self-interest can be relied upon to ensure that airport subsidies remain in place for their preferred modes of travel. But once their needs are taken care of via luxury air-taxis, how long will it take for them to realise large scale hub airports no longer need to be situated within the city limits and can be operated more effectively from cheaper semi-rural locations ???
Originally prepared 12th November 2000.
Last Revised
p>Last Change: vdeck mod
Visitor
since Sat 21-Feb-2004.
|
 On 26th August
2002, an
On 26th August
2002, an